
SaGeminieTech

Micron Technology, Inc. (MU) – Company Overview, Business Model & Stock Analysis

Micron Technology, Inc. (Nasdaq: MU) is a Boise, Idaho-based semiconductor company that designs and manufactures DRAM, NAND and NOR memory and storage products, sold under its Micron and Crucial brands into data-center, PC, mobile, automotive, industrial and consumer markets. This page profiles the listed company and its stock: it brings together TradingView market widgets, financial reference data taken from Micron’s SEC filings, and a dated, clearly labelled third-party Shariah-screening snapshot for research purposes. Micron’s fiscal year is the 52- or 53-week period ending on the Thursday closest to August 31, so “fiscal 2025” means the year ended August 28, 2025. Widgets update dynamically; the tables and screening notes are static and carry their own reporting periods and dates. For sector context see SaGeminieTech’s Semiconductors hub, the AI and semiconductor sector analysis and the NASDAQ hub.

Micron Technology (MU) Symbol Information

MU trades on the Nasdaq Global Select Market, as stated on the cover of Micron’s annual report, under the ticker symbol MU. The panel below summarizes the current symbol — price, exchange and identifying details — as a quick reference before reviewing deeper fundamentals and charts.


Market information shown here may update dynamically throughout the trading session. Verify any material figure through Micron’s official filings and its investor relations site.

MU Advanced Stock Chart

The interactive chart below displays MU price and volume history across time intervals from intraday to multi-year views. Developments that Micron’s own filings highlight include HBM progress (its 10-K says HBM3E 12-high represented the majority of its HBM shipments in the fourth quarter of fiscal 2025 and that HBM4 samples were delivered to key customers), the repayment of several senior notes and cash tender offers for others during fiscal 2026, strategic customer agreements structured as take-or-pay with binding volume commitments, and leadership appointments announced on August 26, 2026. Memory pricing, customer demand, capital spending, government incentives and trade policy can also influence sentiment, so price history is one input among several and should be read alongside fundamentals. See also SaGeminieTech’s Artificial Intelligence hub.


Chart patterns are not guarantees of future performance. Price movements may reflect quarterly results and guidance, changes in memory prices, capital-spending plans, customer commitments, trade and export policy or broader sentiment toward semiconductor stocks.

Micron Technology Financial Statements and Fundamentals

Key figures worth examining for Micron include revenue and its mix, gross and operating margin, capital expenditure, cash generation, customer concentration and balance-sheet liquidity. In fiscal 2025 revenue was $37.4 billion, up from $25.1 billion in fiscal 2024 and $15.5 billion in fiscal 2023; operating income was $9.8 billion after an operating loss of $5.7 billion in fiscal 2023, and net cash provided by operating activities was $17.5 billion against $15.9 billion of expenditures for property, plant, and equipment (10-K). DRAM made up $28.6 billion, or 76.5%, of fiscal 2025 revenue (calculated from Note 21). One customer accounted for 17% of fiscal 2025 revenue, primarily in the Cloud Memory segment; the 10-K reports 10% for fiscal 2024 and no customer at 10% in fiscal 2023.

The most recent filing covers the quarter ended May 28, 2026. Micron reported revenue of $41.5 billion for the quarter, up from $9.3 billion a year earlier, and operating income of $33.3 billion (10-Q, tables below); revenue for the first nine months of fiscal 2026 was $79.0 billion. On capital return, Micron paid dividends of $0.115 per share in the first and second quarters of fiscal 2026 and $0.15 per share in the third quarter, declared another $0.15 per share on June 24, 2026, and repurchased 2.5 million shares for $650 million in the first nine months of fiscal 2026, none in the third quarter; the 10-Q notes that repurchases are subject to restrictions under its CHIPS Act direct funding agreements. Cash and investments were $30.1 billion at May 28, 2026 (calculated) and debt including finance leases was $5.7 billion, versus $14.6 billion at August 28, 2025 (tables below).

Micron reported financial figures — US GAAP, $ millions, fiscal years
Metric FY2023 (ended Aug 31, 2023) FY2024 (ended Aug 29, 2024) FY2025 (ended Aug 28, 2025)
Revenue (reported) 15,540 25,111 37,378
Gross margin, i.e. gross profit (reported) (1,416) 5,613 14,873
Research and development (reported) 3,114 3,430 3,798
Selling, general, and administrative (reported) 920 1,129 1,205
Operating income (loss) (reported) (5,745) 1,304 9,770
Net income (loss) (reported) (5,833) 778 8,539
Diluted earnings (loss) per share, $ (reported) (5.34) 0.70 7.59
Net cash provided by operating activities (reported) 1,559 8,507 17,525
Expenditures for property, plant, and equipment (reported) 7,676 8,386 15,857
Gross margin percentage (calculated: gross profit ÷ revenue) −9.1% 22.4% 39.8%
Operating margin (calculated: operating income ÷ revenue) −37.0% 5.2% 26.1%
Free cash flow (calculated: operating cash flow − property, plant, and equipment expenditures) (6,117) 121 1,668

Source: Micron Annual Report on Form 10-K for the fiscal year ended August 28, 2025 (SEC filing, filed 2025-10-03); fiscal 2023 and 2024 comparatives as presented in that filing. Micron’s fiscal years 2023–2025 each contained 52 weeks. Rows marked “calculated” are derived by SaGeminieTech from the reported inputs shown and are not company-reported measures. Figures are in millions of U.S. dollars except per-share amounts; parentheses indicate a negative number.

Micron third-quarter fiscal 2026 — US GAAP, $ millions (quarter ended May 28, 2026)
Line item Q3 FY2026 (May 28, 2026) Q3 FY2025 (May 29, 2025)
Revenue 41,456 9,301
Gross margin (gross profit) 35,056 3,508
Research and development 1,316 965
Selling, general, and administrative 407 318
Operating income 33,318 2,169
Net income 28,243 1,885
Revenue growth, year over year (calculated) 345.7% —
Gross margin percentage (calculated) 84.6% 37.7%
Operating margin (calculated) 80.4% 23.3%

Source: Micron Quarterly Report on Form 10-Q for the quarter ended May 28, 2026 (SEC filing, filed 2026-06-25), unaudited. For the first nine months of fiscal 2026 the company reported revenue of $78,959 million, operating income of $55,589 million, net income of $47,268 million and diluted earnings per share of $41.40; the quarter’s diluted earnings per share were $24.67. These amounts are not annualized and should not be read as a forecast.

Micron selected balance-sheet measures — $ millions
Measure As of May 28, 2026 As of Aug 28, 2025
Cash and cash equivalents (reported) 24,995 9,642
Short-term investments (reported) 1,027 665
Long-term marketable investments (reported) 4,106 1,629
Cash and investments, total (calculated: sum of the three lines above) 30,128 11,936
Receivables (reported) 31,025 9,265
Inventories (reported) 8,567 8,355
Debt, current plus long-term, including finance lease obligations (reported lines summed) 5,722 14,577
Total assets (reported) 134,112 82,798
Total equity (reported) 100,724 54,165

Sources: 10-Q for the quarter ended May 28, 2026 (filing) and the fiscal 2025 10-K (filing). Debt is the sum of the current-debt and long-term-debt lines, which include finance lease obligations of $2,670 million and $3,044 million respectively; the 10-Q reports repayment of the 2028, 2029 and 2030 notes and the 2029 term loan during fiscal 2026 and lower balances of the 2031–2035 notes at May 28, 2026 than at August 28, 2025; separately, an 8-K filed 2026-04-01 describes cash tender offers for those notes announced in March 2026. The 10-Q text does not link the two. Micron reports approximately $5 billion of remaining performance obligations at May 28, 2026 under recently executed strategic customer agreements (about one-third expected to be recognized within twelve months); at August 28, 2025 they were not material.


Financial panels should be read across multiple reporting periods rather than a single quarter, and checked against Micron’s filings: the fiscal 2025 Form 10-K and the third-quarter fiscal 2026 Form 10-Q. Micron’s fiscal 2026 ended in early September 2026; its fourth-quarter results and annual report were not yet filed when this page was prepared, so the figures here will be superseded.

Micron Technology Company Profile and Business Model

Micron says it is an industry leader in memory and storage solutions, delivering DRAM, NAND and NOR products through its Micron and Crucial brands, with products that enable AI and compute-intensive applications from the data center to the intelligent edge and client and mobile devices. It manufactures at wholly-owned facilities and also uses subcontractors for certain manufacturing processes. Its 10-K lists principal operations in Taiwan, Singapore, the United States, Japan, Malaysia, China and India, and states that it had approximately 53,000 employees at August 28, 2025, located primarily in Asia, North America and Europe.

Micron reports four segments organized by market: the Cloud Memory Business Unit (hyperscale cloud customers and HBM for all data-center customers), the Core Data Center Business Unit, the Mobile and Client Business Unit, and the Automotive and Embedded Business Unit. For HBM, the 10-K says the company began volume production of 8-high 24GB HBM3E in 2024, that HBM3E 12-high represented the majority of HBM shipments in the fourth quarter of fiscal 2025, and that HBM4 remained on schedule for volume production in calendar 2026. In the 10-Q, Micron says it recently executed strategic customer agreements structured as take-or-pay, with binding multi-year volume commitments and, in many cases, customer deposits; it says the remaining performance obligations disclosed are based on minimum committed volumes and pricing and are not expected to indicate future revenue under these contracts.

The fiscal 2025 10-K (filed October 2025) lists Sanjay Mehrotra as Chairman, President and Chief Executive Officer, and an 8-K signed on June 24, 2026 lists Mark Murphy as Executive Vice President and Chief Financial Officer. On August 26, 2026 Micron announced that Manish Bhatia, formerly Executive Vice President, Global Operations, was appointed President and Chief Operating Officer and that Dr. Scott DeBoer, formerly Executive Vice President, Chief Technology and Products Officer, was appointed President and Chief Technology and Products Officer, effective immediately (8-K). This section profiles the listed company; for wider context on memory in AI systems see SaGeminieTech’s Semiconductors hub and its company profile of ASML, a supplier of chipmaking equipment to the industry.

Micron revenue by technology — US GAAP, $ millions, fiscal years
Technology FY2025 FY2024 FY2023 Share of FY2025 (calculated)
DRAM 10,978 17,603 28,578 76.5%
NAND 4,206 7,227 8,503 22.7%
Other (primarily NOR) 356 281 297 0.8%
Total revenue 37,378 25,111 15,540 100.0%

Source: fiscal 2025 10-K, Note 21 (filing). The 10-K states that revenue is primarily recognized at a point in time when control of the goods transfers, and that substantially all customer contracts are short-term at fixed, negotiated prices.

Micron reportable segments (business units) — US GAAP, $ millions, fiscal 2025
Business unit Revenue Share of revenue (calculated) Operating income
Cloud Memory (CMBU) 13,524 36.2% 6,129
Core Data Center (CDBU) 7,229 19.3% 2,180
Mobile and Client (MCBU) 11,859 31.7% 1,981
Automotive and Embedded (AEBU) 4,753 12.7% 557
All other 13 0.0% (1)
Unallocated (primarily stock-based compensation) — — (1,076)
Total 37,378 100.0% 9,770

Source: fiscal 2025 10-K, segment note (filing). Micron says its business units are based on market segments and that it does not report assets or capital expenditures by segment. Business-unit definitions: CMBU serves large hyperscale cloud customers and HBM for all data-center customers; CDBU serves mid-tier cloud, enterprise and OEM data-center customers and storage for all data-center customers; MCBU serves mobile and client; AEBU serves automotive, industrial and consumer.

Micron business-unit revenue and operating income — US GAAP, $ millions, third quarter of fiscal 2026
Business unit Revenue Q3 FY2026 Revenue Q3 FY2025 Operating income Q3 FY2026 Operating income Q3 FY2025
Cloud Memory (CMBU) 13,769 3,386 10,793 1,573
Core Data Center (CDBU) 11,524 1,530 9,519 307
Mobile and Client (MCBU) 11,521 3,255 9,873 482
Automotive and Embedded (AEBU) 4,634 1,127 3,493 126
All other 8 3 3 2
Unallocated — — (363) (321)
Total 41,456 9,301 33,318 2,169

Source: 10-Q for the quarter ended May 28, 2026 (filing), unaudited. All four business units reported higher revenue than a year earlier.


Micron’s revenue is concentrated in DRAM (76.5% of fiscal 2025, calculated) and in a small number of large customers (one customer was 17% of fiscal 2025 revenue). Business-unit mix changed sharply in the latest quarter: Core Data Center revenue rose from $1.5 billion to $11.5 billion year over year. For the wider industry context see SaGeminieTech’s Semiconductors hub.

Micron Technology Technical Analysis

This widget summarizes technical indicators — moving averages, oscillators and overall signal counts — for MU across selected timeframes.


Technical signals change as new data arrives and should not be treated as a recommendation. Consider them together with fundamentals, the volatility in memory selling prices that Micron’s 10-K describes as a risk, and the timing of quarterly results.

Micron Technology Historical Stock-Price Overview

The overview below covers MU price and percentage change across several date ranges, with volume and moving-average context. Micron’s reported revenue rose from $15.5 billion in fiscal 2023 to $37.4 billion in fiscal 2025 (table above), while operating margin, calculated from reported figures, moved from −37.0% to 26.1% over the same period. Price history is best interpreted alongside those developments and the company’s own description of volatile average selling prices, rather than in isolation.


Historical performance does not guarantee future results and reflects a specific past period only.

Micron Technology Shariah Compliance Snapshot

The snapshot below reflects third-party Shariah screening for MU based on AAOIFI-derived methodology, as reported by two providers, Zoya and Musaffa. Both public pages were read on 2026-09-21. Screening results change as market capitalization, debt, cash and non-permissible income change — treat this as a starting reference, not a permanent certification. Neither provider’s screen is an AAOIFI certification, and each applies its own thresholds.

Current StatusScreened as Shariah-compliant by Zoya (AAOIFI standard; last updated September 2026) and as HALAL with a B+ rating by Musaffa (AAOIFI-based methodology; last updated July 2, 2026, 2026 Q3 report). The two sources agree as of 2026-09-21 — independent current verification required
Debt / Market CapManual verification required (not disclosed on Zoya’s public page; Musaffa’s detailed report is behind login). For reference, Micron’s 10-Q reports debt including finance leases of $5.7 billion at May 28, 2026 versus $14.6 billion at August 28, 2025 — re-verify the latest status before relying on it
Cash + Securities / Market CapManual verification required (not disclosed on Zoya’s public page; Musaffa’s detailed report is behind login)
Non-Permissible IncomeZoya reports interest income of $496 million, 1.33% of combined revenue and interest income, for the fiscal year ended August 28, 2025 (revenue $37,378 million) — manual verification required
Screening BasisAAOIFI Standard (per Zoya’s and Musaffa’s stated methodologies)
Last ReviewedZoya last updated September 2026 (cites the fiscal year ended August 28, 2025); Musaffa last updated July 2, 2026 (2026 Q3 report). The two providers may use different reporting periods. Both pages were read on 2026-09-21; figures were not independently re-verified on this page
Shariah compliance can change when market capitalization, debt, cash, interest-bearing assets or non-permissible income changes. This snapshot reflects two third-party providers (Zoya and Musaffa) and is not a permanent certification. Confirm the latest status through Zoya’s Shariah screening, Musaffa’s Shariah screening or a qualified Shariah adviser before making an investment decision. For general screening context see SaGeminieTech’s halal stocks guide.

Latest Micron Technology News

The feed below may include dynamically updated market stories related to Micron.


Distinguish between official Micron announcements, SEC filings, earnings releases, analyst commentary and general media coverage. Verify material news through Micron’s investor relations page and its SEC filings.

Key Investor Considerations for Micron Technology

Potential Strengths

  • Revenue of $37.4 billion in fiscal 2025, up from $25.1 billion in fiscal 2024, and $41.5 billion in the quarter ended May 28, 2026 versus $9.3 billion a year earlier (company-reported)
  • Operating margin of 26.1% in fiscal 2025 and 80.4% in the quarter ended May 28, 2026, versus −37.0% in fiscal 2023 (calculated from reported figures)
  • Net cash provided by operating activities of $17.5 billion in fiscal 2025 and $45.7 billion in the first nine months of fiscal 2026
  • Cash and investments of $30.1 billion (calculated) against debt including finance leases of $5.7 billion at May 28, 2026, after repaying several notes in fiscal 2026
  • A portfolio spanning DRAM, NAND and NOR across four market-based business units, with HBM3E in volume shipments and HBM4 sampling per the 10-K

Material Risks

  • Volatility in average selling prices: the 10-K says annual DRAM average-selling-price changes over the past five years ranged from plus low 40% to a minus high 40% range, and it lists selling-price volatility as its first risk factor
  • Customer concentration: one customer accounted for 17% of fiscal 2025 revenue, primarily in the Cloud Memory segment
  • Capital intensity: expenditures for property, plant, and equipment were $15.9 billion in fiscal 2025 and $19.6 billion in the first nine months of fiscal 2026, and the 10-K warns that expected returns from capacity expansions may not be realized
  • Government incentives carry conditions: the filings say failure to meet investment, construction or other milestones could lead to clawbacks, and that CHIPS Act direct funding agreements restrict some capital-return actions
  • International operations, tariffs, trade restrictions and geopolitical risk, listed among the 10-K’s risk factors, with principal operations in several Asian countries
  • Litigation, including patent-infringement suits by Netlist concerning certain memory modules and HBM products described in the 10-Q, and dependence on strategic customer agreements whose realization the company says is not indicated by disclosed minimums

Frequently Asked Questions

What does Micron Technology do?

Micron designs and manufactures DRAM, NAND and NOR memory and storage products sold under the Micron and Crucial brands, according to its fiscal 2025 Form 10-K. Its products serve data-center, PC, mobile, automotive, industrial and consumer markets.

On which exchange is Micron listed?

Micron’s common stock trades on the Nasdaq Global Select Market under the ticker symbol MU, as stated on the cover of its 10-K and shown in the SEC’s ticker and exchange listing.

What is Micron’s fiscal year?

Micron’s fiscal year is the 52- or 53-week period ending on the Thursday closest to August 31. Fiscal 2025 ended August 28, 2025 and contained 52 weeks; the company reported revenue of $37,378 million and net income of $8,539 million for that year under US GAAP.

What are Micron’s business segments?

Micron reports four business units: Cloud Memory (CMBU), Core Data Center (CDBU), Mobile and Client (MCBU), and Automotive and Embedded (AEBU). In fiscal 2025 they generated $13.5 billion, $7.2 billion, $11.9 billion and $4.8 billion of revenue respectively.

Does Micron pay dividends and buy back shares?

Yes. Micron paid dividends of $0.115 per share in the first two quarters of fiscal 2026 and $0.15 per share in the third quarter, and its Board declared $0.15 per share on June 24, 2026. It repurchased 2.5 million shares for $650 million in the first nine months of fiscal 2026. Confirm current terms on Micron’s investor relations page.

Is Micron a cyclical company?

Micron’s 10-K describes significant volatility in average selling prices for its memory and storage products and lists it as its first risk factor. Its revenue and operating results have changed sharply between fiscal years, as the tables on this page show.

Is Micron stock currently Shariah compliant?

Zoya screens MU as Shariah-compliant (last updated September 2026) and Musaffa classifies it as HALAL with a B+ rating (last updated July 2, 2026), both under AAOIFI-based methodologies. Ratios are not public, so check a current, named screening source before relying on any compliance status.

Conclusion

Micron is a large memory and storage manufacturer whose reported results have swung widely: revenue of $15.5 billion and an operating loss of $5.7 billion in fiscal 2023, $37.4 billion of revenue and $9.8 billion of operating income in fiscal 2025, and $41.5 billion of revenue in the quarter ended May 28, 2026 alone. That profile is balanced against the volatility in selling prices that its own filings describe, customer concentration, very high capital spending, conditions attached to government incentives, trade and geopolitical exposure, litigation, and the fact that its fiscal 2026 annual results were not yet filed when this page was prepared. The tools on this page — charts, financials, technical indicators and news — support ongoing research into Micron, but they do not replace a review of its official filings or independent financial, legal, tax or Shariah advice.

This page is informational and is not investment advice, a recommendation to buy, sell or hold any security, or a prediction of future returns. See SaGeminieTech’s Disclaimer.
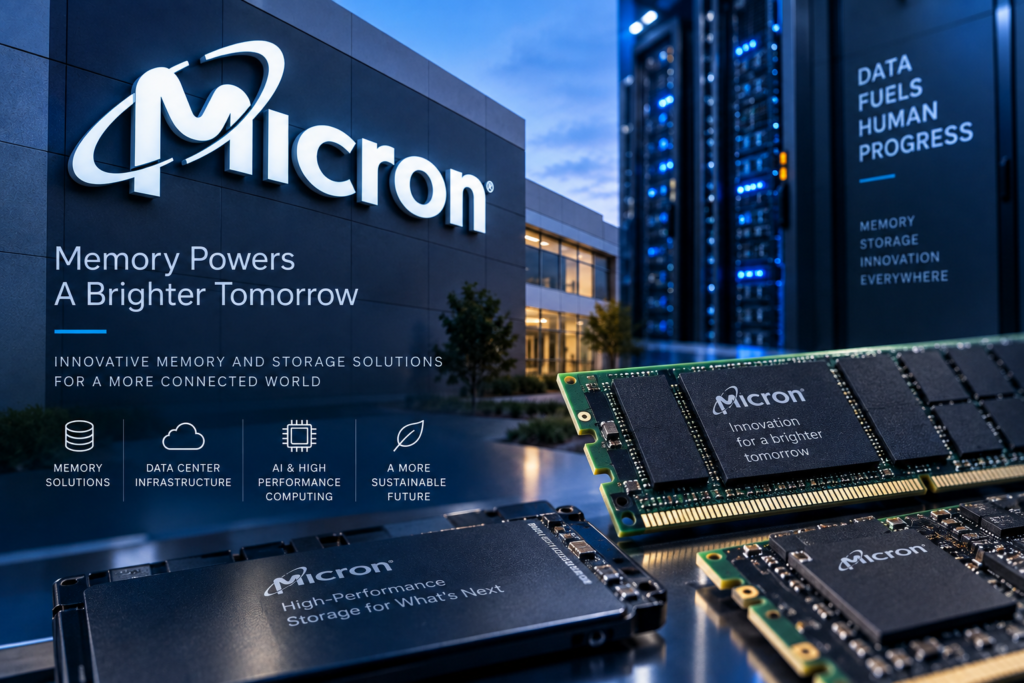
Micron Technology semiconductor memory and data center infrastructure

Scroll to Top