
SaGeminieTech

KLA Corporation (KLAC) – Company Overview, Business Model & Stock Analysis

KLA Corporation (Nasdaq: KLAC) is a Milpitas, California-based semiconductor company that designs, manufactures and markets process-control, inspection, metrology and yield-management systems used in semiconductor, PCB and display manufacturing. This page profiles the listed company and its stock: it brings together TradingView market widgets, financial reference data taken from KLA’s SEC filings, and a dated, clearly labelled third-party Shariah-screening snapshot for research purposes. KLA’s fiscal year ends June 30, so “fiscal 2026” means the year ended June 30, 2026; on June 11, 2026 the company effected a ten-for-one stock split, and all share and per-share figures on this page are shown on a post-split basis, matching the 10-K’s own retroactive restatement. Widgets update dynamically; the tables and screening notes are static and carry their own reporting periods and dates. For sector context see SaGeminieTech’s Semiconductors hub, the AI and semiconductor sector analysis and the NASDAQ hub.

KLA Corporation (KLAC) Symbol Information

KLAC trades on the Nasdaq Global Select Market, as stated on the cover of KLA’s annual report, under the ticker symbol KLAC. The panel below summarizes the current symbol — price, exchange and identifying details — as a quick reference before reviewing deeper fundamentals and charts.


Market information shown here may update dynamically throughout the trading session. Verify any material figure through KLA’s official filings and its investor relations site.

KLAC Advanced Stock Chart

The interactive chart below displays KLAC price and volume history across time intervals from intraday to multi-year views. Developments that KLA’s own filings highlight include the ten-for-one stock split effected June 11, 2026, a quarterly cash dividend of $0.230 per share declared August 6, 2026, and $9.74 billion remaining under the company’s share-repurchase authorization at fiscal year-end. Semiconductor capital-spending cycles, export-control policy toward China, and customer concentration can also influence sentiment, so price history is one input among several and should be read alongside fundamentals. See also SaGeminieTech’s Artificial Intelligence hub.


Chart patterns are not guarantees of future performance. Price movements may reflect quarterly results and guidance, semiconductor capital-spending cycles, export-control and trade policy toward China, or broader sentiment toward semiconductor-equipment stocks. Historical price levels before June 11, 2026 reflect the pre-split share count unless a provider has adjusted them.

KLA Corporation Financial Statements and Fundamentals

Key figures worth examining for KLA include revenue and its mix by segment and region, gross and operating margin, capital expenditure, cash generation and customer concentration. In fiscal 2026 total revenue was $13,579 million, up from $12,156 million in fiscal 2025 and $9,812 million in fiscal 2024; operating income (calculated) was $5,660 million and net income was $4,831 million, both fiscal 2026 records over the period shown (10-K). In each of fiscal 2026 and fiscal 2025, one customer accounted for approximately 19% of total revenues; in fiscal 2024, one customer accounted for approximately 13%.

The fiscal 2026 10-K, filed August 6, 2026, is KLA’s most recent annual filing; no more recent quarterly report has yet been filed for the quarter ending September 30, 2026. Cash and marketable securities were $4,902 million (calculated) against long-term debt of $5,887 million at June 30, 2026. The Board declared a quarterly cash dividend of $0.230 per share (post-split) on August 6, 2026, and approximately $9.74 billion remained available under the share-repurchase authorization at fiscal year-end, after a $7.00 billion increase approved by the Board on March 11, 2026.

KLA Corporation reported financial figures — US GAAP, $ millions, fiscal years
Metric FY2024 (ended June 30, 2024) FY2025 (ended June 30, 2025) FY2026 (ended June 30, 2026)
Total revenue (reported) 9,812 12,156 13,579
Gross profit (calculated: revenue − cost of revenues) 5,884 7,404 8,324
Research and development (reported) 1,279 1,360 1,532
Operating income (calculated: gross profit − R&D − SG&A − impairment) 3,346 4,775 5,660
Net income (reported) 2,762 4,062 4,831
Diluted earnings per share, $ (reported) 2.03 3.04 3.66
Net cash provided by operating activities (reported) 3,309 4,082 4,143
Capital expenditures (reported) 277 335 376
Gross margin (calculated: gross profit ÷ revenue) 60.0% 60.9% 61.3%
Operating margin (calculated: operating income ÷ revenue) 34.1% 39.3% 41.7%
Free cash flow (calculated: operating cash flow − capital expenditures) 3,032 3,747 3,767

Source: KLA Corporation Annual Report on Form 10-K for the fiscal year ended June 30, 2026 (SEC filing, filed 2026-08-06); fiscal 2025 and 2024 comparatives as presented in that filing. KLA’s fiscal year ends June 30. All figures were retroactively adjusted for the ten-for-one stock split effected June 11, 2026, per the 10-K’s own restatement. Rows marked “calculated” are derived by SaGeminieTech from the reported inputs shown. Figures are in millions of U.S. dollars except per-share amounts.

KLA Corporation selected balance-sheet measures — $ millions, as of June 30, 2026
Measure Value (reported)
Cash and cash equivalents 1,650
Marketable securities 3,253
Cash and marketable securities, total (calculated: sum of the two lines above) 4,902
Long-term debt 5,887
Total assets 17,952
Total stockholders’ equity 6,350

Source: fiscal 2026 10-K consolidated balance sheet (filing). KLA reports a single “Long-term debt” line with no separate current portion at this date. The 10-K’s own MD&A states cash, cash equivalents and marketable securities totalled $4.90 billion at June 30, 2026, matching the calculated total here.


Financial panels should be read across multiple reporting periods rather than a single quarter, and checked against KLA’s filings: the fiscal 2026 Form 10-K. KLA’s first-quarter fiscal 2027 results were not yet filed when this page was prepared, so the figures here will be superseded.

KLA Corporation Company Profile and Business Model

KLA says it provides process-control, inspection, metrology and yield-management solutions to the semiconductor and related electronics industries. The company reports in **three reportable segments**: Semiconductor Process Control (inspection, metrology, data-analytics products and related services), Specialty Semiconductor Process (advanced vacuum deposition and etching process tools), and PCB and Component Inspection (inspection, test and measurement for printed circuit boards, flat-panel displays and integrated circuits).

Semiconductor Process Control was approximately 90% of fiscal 2026 segment revenue, with Specialty Semiconductor Process and PCB and Component Inspection making up the remainder (calculated, table below). Geographically, China (30%), Taiwan (27%) and Korea (14%) were the three largest markets by fiscal 2026 revenue, together with North America (13%), Japan (7%), Europe and Israel (5%) and the rest of Asia (5%) (calculated shares, table below).

The fiscal 2026 10-K (filed August 6, 2026) lists Richard P. Wallace as President and Chief Executive Officer, and Bren D. Higgins as Executive Vice President and Chief Financial Officer. This section profiles the listed company; for other semiconductor-equipment suppliers already covered, see SaGeminieTech’s Lam Research, ASML and Applied Materials company profiles.

KLA Corporation reportable segments — US GAAP, $ millions, fiscal years
Segment Revenue FY2026 Revenue FY2025 Revenue FY2024 Share of FY2026 segment revenue (calculated)
Semiconductor Process Control 12,245 10,947 8,734 90.2%
Specialty Semiconductor Process 584 587 529 4.3%
PCB and Component Inspection 750 622 552 5.5%
Total segment revenue 13,579 12,156 9,815 100.0%

Source: fiscal 2026 10-K MD&A, “Revenues by segment” (https://www.sec.gov/Archives/edgar/data/319201/000031920126000027/klac-20260630.htm). Segment revenues exclude corporate allocations and the effects of changes in foreign-currency exchange rates, so the segment total differs slightly from consolidated total revenue shown elsewhere on this page ($13,579 million). KLA operates in **three reportable segments**.

KLA Corporation revenue by region (ship-to location) — US GAAP, $ millions, fiscal years
Region FY2026 FY2025 FY2024 Share of FY2026 (reported)
China 4,048 4,043 4,197 29.8%
Taiwan 3,644 3,205 1,738 26.8%
Korea 1,834 1,453 907 13.5%
North America 1,757 1,362 1,071 12.9%
Japan 915 1,133 963 6.7%
Europe and Israel 727 574 540 5.4%
Rest of Asia 654 386 396 4.8%
Total 13,579 12,156 9,812 100.0%

Source: fiscal 2026 10-K MD&A, “Revenues by region” (https://www.sec.gov/Archives/edgar/data/319201/000031920126000027/klac-20260630.htm). Revenue is attributed by ship-to location, not necessarily the location of end use. China, Taiwan and Korea together were approximately 70% of fiscal 2026 revenue (calculated).


KLA’s revenue is concentrated in its Semiconductor Process Control segment and geographically in China, Taiwan and Korea (approximately 70% of fiscal 2026 revenue combined, calculated). For the wider industry context see SaGeminieTech’s Semiconductors hub.

KLA Corporation Technical Analysis

This widget summarizes technical indicators — moving averages, oscillators and overall signal counts — for KLAC across selected timeframes.


Technical signals change as new data arrives and should not be treated as a recommendation. Consider them together with fundamentals, semiconductor capital-spending cycles, and export-control policy toward China, which KLA’s filings describe as a risk. Note the June 11, 2026 ten-for-one stock split when interpreting price history.

KLA Corporation Historical Stock-Price Overview

The overview below covers KLAC price and percentage change across several date ranges, with volume and moving-average context. KLA’s reported revenue rose from $9,812 million in fiscal 2024 to $13,579 million in fiscal 2026 (table above), while operating margin, calculated from reported figures, moved from 34.1% to 41.7% over the same period. Price history is best interpreted alongside those developments, the June 2026 stock split, and the export-control and customer-concentration factors the company’s own filings describe, rather than in isolation.


Historical performance does not guarantee future results and reflects a specific past period only. Figures before June 11, 2026 should be checked for stock-split adjustment.

KLA Corporation Shariah Compliance Snapshot

The snapshot below reflects third-party Shariah screening for KLAC based on AAOIFI-derived methodology, as reported by two providers, Zoya and Musaffa, plus figures independently calculated by SaGeminieTech from KLA’s SEC filings and a market-capitalization snapshot. Both provider pages were read on 2026-09-24. Screening results change as market capitalization, debt, cash and non-permissible income change — treat this as a starting reference for further verification, not a certification, and not investment or religious guidance.

Current StatusZoya screens KLAC as Shariah-compliant (zoya.finance/stocks/klac; AAOIFI standard; last updated September 2026) and Musaffa classifies it as HALAL with an A- rating (musaffa.com/stock/KLAC; AAOIFI-based methodology; last updated September 14, 2026, 2026 Annual Report basis). The two sources agree as of 2026-09-24 on business activity and overall classification.
Debt / Market CapIndependently calculated: 2.40%. KLA’s fiscal 2026 10-K reports long-term debt of $5,887 million at June 30, 2026, divided by a market capitalization of $245,160 million as of market close 2026-09-23 (stockanalysis.com). Well under the commonly cited 30–33% threshold. See the calculation table below.
Cash + Securities / Market CapIndependently calculated: 2.00%. Cash and marketable securities of $4,902 million at June 30, 2026, divided by the same $245,160 million market capitalization. Well under the commonly cited 30–33% threshold.
Non-Permissible IncomeZoya’s public page states KLA “has not reported any interest income” for fiscal 2026; this does not match the 10-K’s own XBRL data, which tags $177 million of interest income (tag InvestmentIncomeInterest) on revenue of $13,579 million. Computed independently from the filing: 177 ÷ (13,579 + 177) = 1.29% of the combined total, below the 5% threshold both providers cite, but flagged here because Zoya’s stated basis for its verdict is inaccurate on this point, as it was for Applied Materials and Twilio on earlier SaGeminieTech pages.
Business ActivitySemiconductor, PCB and display process-control, inspection, metrology and yield-management equipment and software. No lending, conventional banking, insurance, gambling or alcohol-related activity was found in the 10-K’s description of the business.
Screening BasisAAOIFI Standard (per Zoya’s and Musaffa’s stated methodologies), cross-checked here against KLA’s own fiscal 2026 Form 10-K and a same-day market-capitalization snapshot. The two providers cite different report-basis dates (Zoya: fiscal year ended June 30, 2026; Musaffa: 2026 Annual Report), so their agreement is not necessarily on an identical time base.
Last ReviewedZoya last updated September 2026; Musaffa last updated September 14, 2026. Both provider pages were read on 2026-09-24; the debt, cash and income figures were independently recalculated from the 10-K and a 2026-09-23 market-capitalization snapshot as shown above.
KLA Corporation AAOIFI-style screening ratios — independently calculated
Ratio Numerator Denominator Result Commonly cited threshold
Interest-bearing debt ÷ market capitalization Long-term debt: $5,887 million (10-K, June 30, 2026) Market capitalization: $245,160 million ([stockanalysis.com](https://stockanalysis.com/stocks/klac/), close 2026-09-23) 2.40% < 30–33%
(Cash + interest-bearing securities) ÷ market capitalization Cash + marketable securities: $4,902 million (10-K, June 30, 2026) Market capitalization: $245,160 million ([stockanalysis.com](https://stockanalysis.com/stocks/klac/), close 2026-09-23) 2.00% < 30–33%
Non-permissible (interest) income ÷ (revenue + interest income) Interest income: $177 million (10-K XBRL, FY2026, tag InvestmentIncomeInterest) Revenue + interest income: $13,579m + $177m = $13,756m 1.29% < 5%

Market capitalization is a point-in-time figure (2026-09-23 close) applied against fiscal-year-end balance-sheet figures (June 30, 2026); it will move daily and these ratios should be recalculated before relying on them. Thresholds shown are the ranges commonly cited under AAOIFI-derived screening methodologies (including by Zoya and Musaffa); this page does not adopt one specific scholar’s threshold as authoritative.

This snapshot is a screening summary for research purposes, not a certification of Shariah compliance and not investment or religious guidance. All three AAOIFI-style ratios were independently calculated for this page and fall well under commonly cited thresholds, but market capitalization changes daily and these figures should be recalculated before relying on them. Confirm the latest status directly with Zoya, with Musaffa, or with a qualified Shariah adviser before relying on any compliance conclusion.

Latest KLA Corporation News

The feed below may include dynamically updated market stories related to KLA.


Distinguish between official KLA announcements, SEC filings, earnings releases, analyst commentary and general media coverage. Verify material news through KLA’s investor relations page and its SEC filings.

Key Investor Considerations for KLA Corporation

Potential Strengths

  • Revenue of $13,579 million in fiscal 2026, up from $12,156 million in fiscal 2025 and $9,812 million in fiscal 2024 (company-reported)
  • Operating margin of 41.7% and gross margin of 61.3% in fiscal 2026, both improving versus fiscal 2024 (calculated from reported figures)
  • Net cash provided by operating activities of $4,143 million in fiscal 2026, with cash and marketable securities of $4,902 million against long-term debt of $5,887 million at fiscal year-end (calculated)
  • Three-segment structure led by Semiconductor Process Control, with services and recurring revenue from an expanding installed base
  • Ongoing capital return: a quarterly dividend of $0.230 per share (post-split) declared August 6, 2026, and approximately $9.74 billion remaining under the share-repurchase authorization

Material Risks

  • Customer concentration: one customer accounted for approximately 19% of total revenues in each of fiscal 2026 and fiscal 2025
  • Geographic and export-control exposure: China, Taiwan and Korea together were about 70% of fiscal 2026 revenue (calculated), and the 10-K discusses the adverse impact of export controls and tariffs on results of operations, particularly regarding China
  • Cyclicality: semiconductor-equipment demand depends on customers’ capital-spending plans, which historically have been variable
  • Segment concentration: Semiconductor Process Control is the large majority of segment revenue, so results depend heavily on that single segment’s demand cycle
  • Recent stock split: the June 11, 2026 ten-for-one split changes per-share comparisons; historical price and EPS data must be checked for split-adjustment
  • Interest-bearing debt of $5,887 million at fiscal year-end, which the 10-K notes carries its own covenant and refinancing considerations

Frequently Asked Questions

What does KLA Corporation do?

KLA Corporation designs, manufactures and markets process-control, inspection, metrology and yield-management systems used in semiconductor, PCB and display manufacturing, according to its fiscal 2026 Form 10-K.

On which exchange is KLA listed?

KLA’s common stock trades on the Nasdaq Global Select Market under the ticker symbol KLAC, as confirmed against the SEC’s ticker-and-exchange listing.

What are KLA’s reportable segments?

As of its fiscal 2026 10-K, KLA reports **three** reportable segments: Semiconductor Process Control, Specialty Semiconductor Process, and PCB and Component Inspection.

Did KLA have a stock split?

Yes. KLA effected a ten-for-one stock split of its common stock on June 11, 2026. All share and per-share figures in the fiscal 2026 10-K, and on this page, are presented on a post-split basis.

Does KLA pay dividends and buy back shares?

Yes. KLA’s Board declared a quarterly cash dividend of $0.230 per share (post-split) on August 6, 2026, and approximately $9.74 billion remained available under its share-repurchase authorization at fiscal year-end June 30, 2026, following a $7.00 billion increase approved in March 2026. Confirm current terms on KLA’s investor relations page.

Is KLA exposed to China and export controls?

The 10-K states that regulations affecting trade, including export controls and tariffs, have had an adverse impact on results of operations, and identifies China as a market where this exposure is significant. China was approximately 30% of fiscal 2026 revenue by ship-to location.

Is KLA stock currently Shariah compliant?

Zoya screens KLAC as Shariah-compliant (last updated September 2026) and Musaffa classifies it as HALAL with an A- rating (last updated September 14, 2026), both under AAOIFI-based methodologies. SaGeminieTech independently calculated all three AAOIFI-style ratios from the 10-K and a same-day market-capitalization snapshot: debt/market cap 2.40%, cash+securities/market cap 2.00%, and non-permissible income 1.29% — all under commonly cited thresholds, though Zoya’s own stated basis for the interest-income figure is inaccurate. This is a screening summary, not a compliance certification — check a current, named screening source or a qualified Shariah adviser before relying on any status.

Conclusion

KLA is a large semiconductor process-control and yield-management equipment supplier whose fiscal 2026 revenue of $13,579 million and operating income of $5,660 million (calculated) reflect continued demand tied to advanced semiconductor manufacturing, alongside a ten-for-one stock split and continued capital return through dividends and buybacks. That profile is balanced against concentration in a small number of large customers, heavy exposure to China, Taiwan and Korea alongside disclosed export-control and tariff risk, the historical cyclicality of semiconductor capital spending, and a business that remains concentrated in its Semiconductor Process Control segment. SaGeminieTech independently verified KLA’s Shariah-screening ratios against its own SEC filings and a same-day market-capitalization snapshot, finding all three commonly used AAOIFI-style ratios well under typical thresholds. The tools on this page — charts, financials, technical indicators and news — support ongoing research into KLA, but they do not replace a review of its official filings or independent financial, legal, tax or Shariah advice.

This page is informational and is not investment advice, a recommendation to buy, sell or hold any security, or a prediction of future returns. See SaGeminieTech’s Disclaimer.
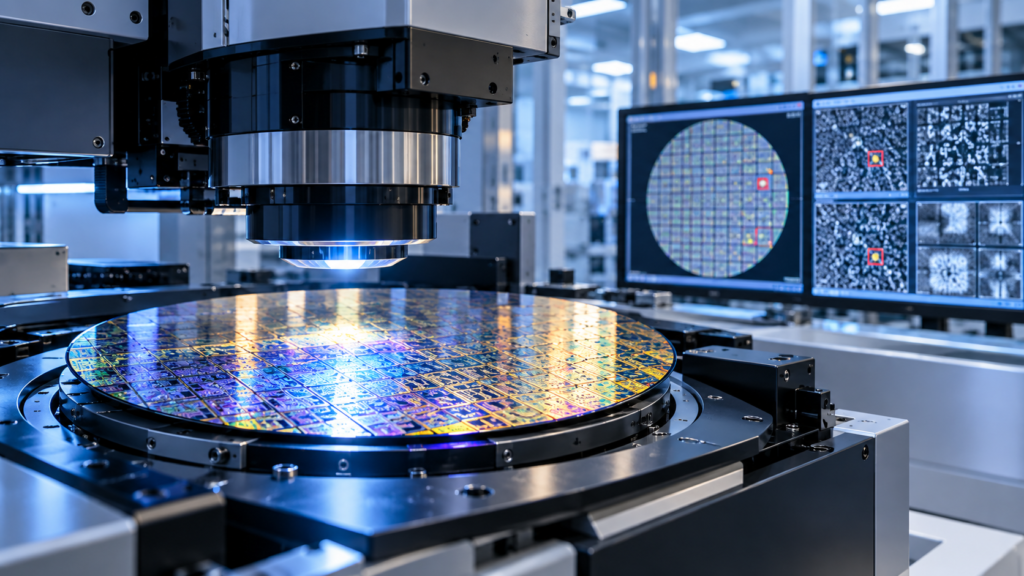
Conceptual semiconductor wafer inspection scene for a KLA Corporation (KLAC) company overview and stock analysis.

Scroll to Top