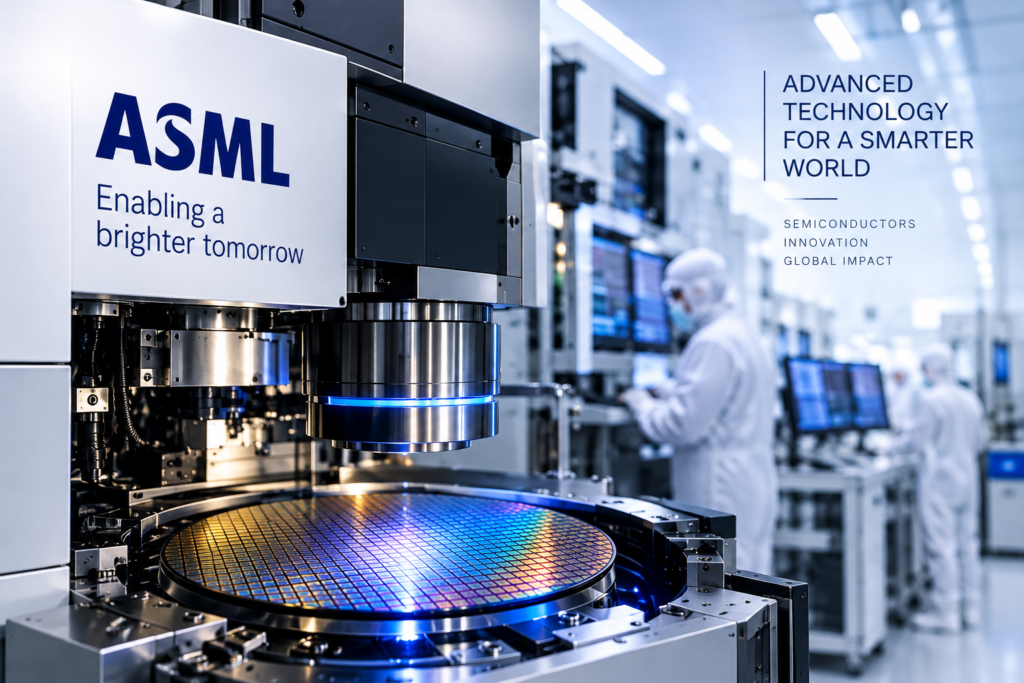
ASML Holding N.V. (NASDAQ: ASML) is a Netherlands-based supplier of lithography, metrology and inspection systems that chipmakers use to pattern integrated circuits. According to the company, its ordinary shares trade on Euronext Amsterdam and NASDAQ under the symbol ASML; this page follows the NASDAQ listing and reports ASML’s financial figures in euros under US GAAP, which the company describes as its primary accounting standard for quarterly earnings releases and annual reports. It brings together TradingView market widgets, financial reference data taken from ASML’s SEC filings, and a dated, clearly labelled third-party Shariah-screening snapshot for research purposes. Widgets update dynamically; the tables and screening notes are static and carry their own reporting periods and dates. For related coverage, see SaGeminieTech’s Semiconductors ecosystem page and the NASDAQ hub.
ASML Holding (ASML) Symbol Information
ASML trades on NASDAQ under the symbol ASML and, per the company, also on Euronext Amsterdam. The panel below is configured for the NASDAQ listing (NASDAQ:ASML) and summarizes the symbol’s exchange and identifying details as a quick reference. ASML’s reported financial figures elsewhere on this page are in euros.
Market information shown here may update dynamically throughout the trading session. Verify any material figure through ASML’s official filings and its investor relations site.
ASML Advanced Stock Chart
The interactive chart below displays ASML price and volume history across time intervals from intraday to multi-year views. ASML’s results depend on the capital spending of a small group of chipmakers: in 2025 four customers each exceeded 10% of total net sales and together accounted for 61.2% of the total (20-F). Order momentum for EUV and DUV systems, quarterly guidance, export-control changes affecting sales to China, and the pace of AI-related capacity additions at Logic and Memory customers are among the developments that ASML itself highlights, so price history is one input among several and should be read alongside fundamentals rather than in isolation. See also SaGeminieTech’s Artificial Intelligence pillar page.
Chart patterns are not guarantees of future performance. Price movements may reflect quarterly results and guidance, customer capital-spending plans, export-control developments, currency movements or broader sentiment toward semiconductor equipment stocks.
ASML Holding Financial Statements and Fundamentals
Key figures worth examining for ASML include total net sales and its split between net system sales and net service and field option sales (which ASML also reports as Installed Base Management sales), gross margin, operating income, cash generation and shareholder returns. In fiscal 2025 total net sales were €32.7 billion, up 15.6% on 2024, and gross margin was 52.8% (20-F); net system sales of €24.5 billion made up about three quarters of the total (74.9%, calculated). ASML’s 2025 annual report states that it returned €8.5 billion to shareholders in 2025.
On capital return, ASML reported that its shareholders adopted a final dividend of €2.70 per ordinary share at the April 22, 2026 Annual General Meeting (AGM results release); together with three interim dividends of €1.60 per ordinary share (the last paid in February 2026) this gives a total dividend of €7.50 per ordinary share for 2025. In its July 15, 2026 results release ASML announced an interim dividend over 2026 of €1.88 per ordinary share, payable August 5, 2026, and reported buying back around €1.1 billion of shares in the second quarter under its 2026–2028 share buyback program.
Company guidance (not a SaGeminieTech forecast): in that release ASML said it expects Q3 2026 total net sales between €11.0 billion and €12.0 billion with a gross margin between 55% and 57%, and 2026 total net sales between €43 billion and €45 billion with a gross margin between 54% and 56%.
| Metric | FY2023 | FY2024 | FY2025 |
|---|---|---|---|
| Total net sales (reported) | 27,558.5 | 28,262.9 | 32,667.3 |
| Gross profit (reported) | 14,136.1 | 14,492.0 | 17,258.0 |
| Income from operations (reported) | 9,042.3 | 9,022.6 | 11,301.4 |
| Net income (reported) | 7,839.0 | 7,571.6 | 9,609.4 |
| Net cash provided by operating activities (reported) | 5,443.4 | 11,166.2 | 12,658.5 |
| Gross margin (calculated: gross profit ÷ total net sales) | 51.3% | 51.3% | 52.8% |
| Operating margin (calculated: income from operations ÷ total net sales) | 32.8% | 31.9% | 34.6% |
| Free cash flow (calculated: operating cash flow − purchases of property, plant and equipment − purchases of intangible assets) | 3,247.2 | 9,083.1 | 11,027.3 |
Source: ASML Annual Report on Form 20-F for fiscal 2025 (SEC filing, filed 2026-02-25), US GAAP consolidated statements; fiscal 2023 and 2024 comparatives as presented in that filing. Rows marked “calculated” are derived by SaGeminieTech from the reported inputs shown and are not company-reported measures. Figures are in millions of euros.
| Metric | Q1 2026 (quarter ended Mar 29, 2026) | Q2 2026 (quarter ended Jun 28, 2026) |
|---|---|---|
| Total net sales | 8,767 | 9,326 |
| of which Installed Base Management sales (net service and field option sales) | 2,488 | 2,762 |
| Gross profit | 4,645 | 5,035 |
| Gross margin (reported) | 53.0% | 54.0% |
| Net income | 2,757 | 2,918 |
| Basic earnings per share (€) | 7.15 | 7.59 |
| New lithography systems sold (units) | 67 | 86 |
| Cash and cash equivalents and short-term investments (end of quarter) | 8,376 | 7,582 |
Source: ASML press release dated July 15, 2026 (Exhibit 99.1 to the Form 6-K filed 2026-07-15). The company states the quarterly statements are unaudited. Do not add the two quarters to derive a half-year figure without checking the company’s interim report.
Financial panels should be read across multiple reporting periods rather than a single quarter, and checked against ASML’s filings: the 2025 Form 20-F and the Q2 2026 results release. The static tables above use a euro reporting basis; the widget below may present data on a different basis.
ASML Holding Company Profile and Business Model
ASML describes itself as a holistic lithography solution provider and reports one segment: the development, production, marketing, sales, upgrading and servicing of advanced semiconductor equipment systems, consisting of lithography, metrology and inspection systems (20-F, Note 3). Its customers are chipmakers; in 2025 net system sales were €16,054.1 million to Logic and €8,420.2 million to Memory. Most net sales come from volume purchase agreements with multiple performance obligations such as systems, options, installation, training and extended warranties.
By technology, ASML reports EUV systems (the NXE platform and the newer EXE platform, which the annual report discusses as High NA EUV), DUV systems (ArF immersion, ArF dry, KrF and i-line) and metrology and inspection systems, with upgrades and servicing of the installed base reported as net service and field option sales. In 2025, EUV (NXE and EXE) accounted for €11,602.7 million, or 47.4%, of net system sales (calculated), and ArF immersion for 42.1%. ASML is headquartered in Veldhoven, the Netherlands, says it has served chipmakers since 1984, and reported more than 44,500 employees (FTE) in its July 2026 release.
Christophe Fouquet is President, Chief Executive Officer and Chair of the Board of Management, and Roger Dassen is Executive Vice President and Chief Financial Officer, as named in ASML’s 2025 annual report and July 2026 results release. For DUV systems the company says it competes primarily with Canon and Nikon, and it identifies Carl Zeiss SMT as its sole supplier of lenses, mirrors, illuminators, collectors and other critical optical components.
| Technology | Systems sold (units) | Net system sales (€ millions) | Share of net system sales (calculated) |
|---|---|---|---|
| EXE | 4 | 1,156.9 | 4.7% |
| NXE | 44 | 10,445.8 | 42.7% |
| ArF immersion | 131 | 10,311.4 | 42.1% |
| ArF dry | 16 | 427.0 | 1.7% |
| KrF | 78 | 1,001.3 | 4.1% |
| I-line | 54 | 307.3 | 1.3% |
| Metrology & Inspection | 208 | 824.6 | 3.4% |
| Total net system sales | 535 | 24,474.3 | 100.0% |
Source: ASML 2025 Form 20-F, Note 2 “Revenue from contracts with customers” (filing). Shares are calculated and may not sum to exactly 100% because of rounding. ASML reports net service and field option sales separately; for fiscal 2025 they equal total net sales less net system sales, or €8,193.0 million (calculated).
| Region (as labelled in the 20-F) | Total net sales (€ millions) | Share of total net sales (calculated) |
|---|---|---|
| China | 9,519.7 | 29.1% |
| Taiwan | 8,337.9 | 25.5% |
| South Korea | 8,159.6 | 25.0% |
| United States | 4,089.1 | 12.5% |
| Japan | 1,420.9 | 4.3% |
| Singapore | 608.4 | 1.9% |
| EMEA | 524.3 | 1.6% |
| Netherlands | 4.7 | 0.0% |
| Rest of Asia | 2.7 | 0.0% |
| Total | 32,667.3 | 100.0% |
Source: ASML 2025 Form 20-F, Note 3 “Segment disclosure” (filing). Net sales are attributed to the geographic location of the customers’ facilities. In 2025 four customers each individually exceeded 10% of total net sales, together €20.0 billion or 61.2% of the total, per the same note.
ASML’s reported exposure is concentrated by customer and geography: China, Taiwan and South Korea together accounted for 79.6% of 2025 net sales (calculated), and four customers accounted for 61.2%. Export-control rules in the Netherlands, the United States and China can change sales volume, mix and timing, according to the 20-F. For the wider sector context see SaGeminieTech’s Semiconductors page.
ASML Holding Technical Analysis
This widget summarizes technical indicators — moving averages, oscillators and overall signal counts — for ASML across selected timeframes.
Technical signals change as new data arrives and should not be treated as a recommendation. Consider them together with fundamentals, ASML’s order and backlog commentary (the CEO’s 2025 annual-report statement cites a backlog of €38.8 billion at the time of writing), customer concentration and export-control developments.
ASML Holding Historical Stock-Price Overview
The overview below covers ASML price and percentage change across several date ranges, with volume and moving-average context. ASML’s reported total net sales rose from €27.6 billion in 2023 to €32.7 billion in 2025 (table above); the company attributes the 2025 increase primarily to greater NXE and NXT immersion adoption supported by leading-edge foundry investment for AI demand, EXE systems delivered to and installed at more customers, and higher net service and field option sales. Price history is best interpreted alongside those business developments and guidance changes rather than in isolation.
Historical performance does not guarantee future results and reflects a specific past period only. The widget reflects the NASDAQ listing.
ASML Holding Shariah Compliance Snapshot
The snapshot below reflects third-party Shariah screening for ASML based on AAOIFI-derived methodology, as reported by two providers, Zoya and Musaffa. Both public pages were read on 2026-09-20. Screening results change as market capitalization, debt, cash and non-permissible income change — treat this as a starting reference, not a permanent certification. Neither provider’s screen is an AAOIFI certification, and each applies its own thresholds.
Latest ASML Holding News
The feed below may include dynamically updated market stories related to ASML.
Distinguish between official ASML announcements, SEC filings, results releases, analyst commentary and general media coverage. Verify material news through ASML’s investor relations page and its SEC filings.
Key Investor Considerations for ASML Holding
Potential Strengths
- Total net sales grew 15.6% to €32.7 billion in fiscal 2025, and gross margin rose 1.5 percentage points to 52.8% (20-F)
- Net service and field option sales (Installed Base Management) of about €8,193.0 million in 2025 (calculated) and €2,762 million in Q2 2026 add a revenue stream tied to the installed base of systems
- A portfolio spanning EUV, DUV and metrology and inspection systems, with EUV (NXE and EXE) at 47.4% of 2025 net system sales (calculated)
- Company-cited demand from AI-related investment in Logic and Memory, a backlog of €38.8 billion in the CEO’s annual-report statement, and raised 2026 sales guidance of €43–45 billion (company guidance, July 15, 2026)
- Net cash provided by operating activities of €12.7 billion in fiscal 2025, and €8.5 billion returned to shareholders, as ASML states in its 2025 annual report
Material Risks
- A high percentage of net sales comes from a few customers: four customers each exceeded 10% of 2025 net sales and together represented 61.2%
- Geographic and export-control exposure: China accounted for 29.1% of 2025 net sales (calculated), and changes to export controls may materially affect sales volume, mix and timing (20-F)
- Dependence on Carl Zeiss SMT as the sole supplier of critical optical components; a prolonged supply interruption could limit production and order fulfilment (20-F)
- The 20-F lists cyclicality of the semiconductor industry, intense competition (including Canon and Nikon in DUV) and reliance on a relatively small number of products among its risk factors
- Guidance and outlook statements are company expectations, not established facts, and can change with customer orders, export rules or macroeconomic conditions
Frequently Asked Questions
What does ASML Holding N.V. do?
ASML develops, produces, markets, sells, upgrades and services advanced semiconductor equipment systems — lithography, metrology and inspection systems — for chipmakers, according to its 2025 Form 20-F.
On which exchange is ASML listed?
According to ASML, its ordinary shares trade on Euronext Amsterdam and NASDAQ under the symbol ASML. This page follows the NASDAQ listing (NASDAQ: ASML); the SEC’s ticker and exchange listing also shows ASML on Nasdaq.
What are ASML’s main product categories?
ASML reports net system sales by technology: EUV (NXE and EXE), ArF immersion, ArF dry, KrF, i-line, and metrology and inspection, plus net service and field option sales for its installed base.
How large is ASML and how does it report?
For fiscal 2025 ASML reported total net sales of €32,667.3 million and net income of €9,609.4 million under US GAAP, its primary accounting standard for annual reports and earnings releases. Figures are in euros.
Who are ASML’s main competitors?
In its 2025 Form 20-F, ASML says it competes primarily with Canon and Nikon in respect of DUV systems, and also faces competition from new competitors, including those driven by ambitions of self-sufficiency in the geopolitical context.
Does ASML pay a dividend?
Yes. ASML’s shareholders adopted a final dividend of €2.70 per ordinary share at the April 22, 2026 Annual General Meeting, which with three interim dividends of €1.60 gives a total dividend of €7.50 per ordinary share for 2025 (AGM results release). ASML also announced an interim dividend over 2026 of €1.88 per ordinary share, payable August 5, 2026. Confirm current dividend details on ASML’s investor relations page.
Is ASML stock currently Shariah compliant?
Zoya screens ASML as Shariah-compliant (last updated September 2026) and Musaffa classifies it as HALAL with an A+ rating (last updated August 3, 2026), both under AAOIFI-based methodologies. Ratios are not public, so check a current, named screening source before relying on any compliance status.
Conclusion
ASML supplies the lithography, metrology and inspection systems that chipmakers use to pattern advanced microchips, and its fiscal 2025 results — €32.7 billion of net sales, a 52.8% gross margin and €12.7 billion of operating cash flow — coincided with what the company describes as growing AI-related demand in Logic and Memory. That position is balanced against a customer base in which four buyers accounted for 61.2% of 2025 net sales, exposure to China of 29.1% of net sales alongside evolving export controls, dependence on a sole optics supplier, competition from Canon and Nikon in DUV, and the cyclicality of semiconductor capital spending. The tools on this page — charts, financials, technical indicators and news — support ongoing research into ASML, but they do not replace a review of its official filings or independent financial, legal, tax or Shariah advice.
This page is informational and is not investment advice, a recommendation to buy, sell or hold any security, or a prediction of future returns. See SaGeminieTech’s Disclaimer.