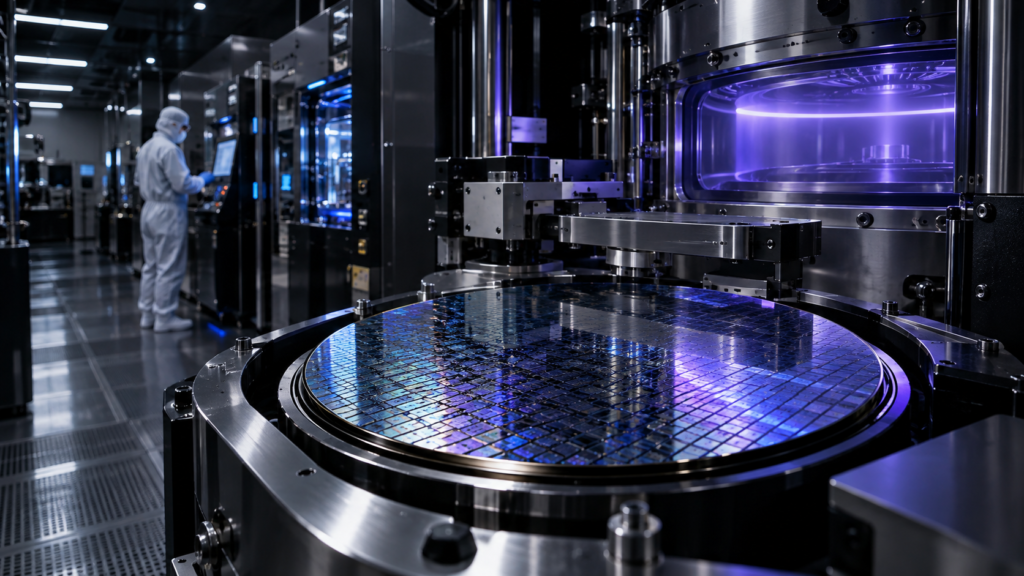
Lam Research Corporation (Nasdaq: LRCX) is a Fremont, California-based semiconductor company that designs, manufactures, markets, refurbishes and services wafer-fabrication equipment used to make integrated circuits, serving memory, foundry and logic/integrated-device customers. This page profiles the listed company and its stock: it brings together TradingView market widgets, financial reference data taken from Lam Research’s SEC filings, and a dated, clearly labelled third-party Shariah-screening snapshot for research purposes. Lam Research’s fiscal year is the 52- or 53-week period ending the last Sunday in June, so “fiscal 2026” means the year ended June 28, 2026. Widgets update dynamically; the tables and screening notes are static and carry their own reporting periods and dates. For sector context see SaGeminieTech’s Semiconductors hub, the AI and semiconductor sector analysis and the NASDAQ hub.
Lam Research Corporation (LRCX) Symbol Information
LRCX trades on the Nasdaq Global Select Market, as stated on the cover of Lam Research’s annual report, under the ticker symbol LRCX. The panel below summarizes the current symbol — price, exchange and identifying details — as a quick reference before reviewing deeper fundamentals and charts.
Market information shown here may update dynamically throughout the trading session. Verify any material figure through Lam Research’s official filings and its investor relations site.
LRCX Advanced Stock Chart
The interactive chart below displays LRCX price and volume history across time intervals from intraday to multi-year views. Developments that Lam Research’s own filings highlight include foundry customers becoming its largest market by revenue share in fiscal 2026 (54%, up from 40% in fiscal 2024), an accelerated share-repurchase agreement settled in June 2026, and a $10.00 billion share-repurchase authorization from May 2024. Semiconductor capital-spending cycles, customer concentration, export-control policy and technology transitions can also influence sentiment, so price history is one input among several and should be read alongside fundamentals. See also SaGeminieTech’s Artificial Intelligence hub.
Chart patterns are not guarantees of future performance. Price movements may reflect quarterly results and guidance, semiconductor capital-spending cycles, customer concentration, export-control and trade policy or broader sentiment toward semiconductor-equipment stocks.
Lam Research Corporation Financial Statements and Fundamentals
Key figures worth examining for Lam Research include revenue and its mix by market and geography, gross and operating margin, cash generation, customer concentration and capital return. In fiscal 2026 revenue was $23.23 billion, up from $18.44 billion in fiscal 2025 and $14.91 billion in fiscal 2024; operating income was $8.20 billion and net income was $7.27 billion (10-K). Foundry customers were 54% of fiscal 2026 equipment and upgrade revenue, memory 39% and logic/IDM 7% (calculated share table below). Four customers together accounted for approximately 55% of fiscal 2026 revenue (16%, 15%, 12% and 12% individually); the 10-K reports two customers at 17% and 15% of fiscal 2025 revenue and one customer at 17% of fiscal 2024 revenue.
The fiscal 2026 10-K, filed August 7, 2026, is the company’s most recent annual filing; its next quarterly report (for the quarter ending in late September 2026) had not yet been filed when this page was prepared. During fiscal 2026 Lam Research’s quarterly dividend declared was $0.26 per share. The company entered a $200.0 million accelerated share-repurchase agreement in March 2026, settled in June 2026, under a $10.00 billion repurchase authorization the Board approved in May 2024. Cash and cash equivalents were $5.58 billion and total debt outstanding was $3.72 billion at June 28, 2026 (tables below).
| Metric | FY2024 (ended Jun 30, 2024) | FY2025 (ended Jun 29, 2025) | FY2026 (ended Jun 28, 2026) |
|---|---|---|---|
| Revenue (reported) | 14,905,386 | 18,435,591 | 23,232,690 |
| Gross margin, i.e. gross profit (reported) | 7,052,791 | 8,979,059 | 11,725,308 |
| Research and development (reported) | 1,902,444 | 2,096,387 | 2,375,873 |
| Selling, general, and administrative (reported) | 868,247 | 981,704 | 1,149,640 |
| Operating income (reported, calculated as income before income taxes less other income, net; see note) | 4,263,913 | 5,900,968 | 8,199,795 |
| Net income (reported) | 3,827,772 | 5,358,217 | 7,265,396 |
| Net cash provided by operating activities (reported) | 4,652,269 | 6,173,264 | 5,857,657 |
| Expenditures for property and equipment (reported; FY2024 not separately disclosed in the FY2026 10-K) | — | 759,186 | 966,405 |
| Gross margin percentage (calculated: gross profit ÷ revenue) | 47.3% | 48.7% | 50.5% |
| Operating margin percentage (calculated: operating income ÷ revenue) | 28.6% | 32.0% | 35.3% |
| Free cash flow (calculated: operating cash flow − property and equipment expenditures; not available for FY2024) | — | 5,414,078 | 4,891,252 |
Source: Lam Research Annual Report on Form 10-K for the fiscal year ended June 28, 2026 (SEC filing, filed 2026-08-07); fiscal 2024 and 2025 comparatives as presented in that filing’s segment note. Lam Research’s fiscal year is the 52- or 53-week period ending the last Sunday in June. “Operating income” here is the segment note’s income before income taxes less other income (expense), net, which reconciles to the amount Lam Research reports as operating income in its selected financial data. Rows marked “calculated” are derived by SaGeminieTech from the reported inputs shown and are not company-reported measures. Figures are in millions of U.S. dollars.
| Measure | As of Jun 28, 2026 | As of Jun 29, 2025 |
|---|---|---|
| Cash and cash equivalents (reported) | 5,579 | 6,391 |
| Accounts receivable, net (reported) | 5,340 | 3,378 |
| Inventories (reported) | 4,276 | 4,308 |
| Total assets (reported) | 23,530 | 21,345 |
| Total debt outstanding, at carrying value (reported) | 3,722 | 4,469 |
| Total liabilities (reported) | 11,059 | 11,484 |
| Total stockholders’ equity (reported) | 12,471 | 9,862 |
Source: fiscal 2026 10-K consolidated balance sheet and debt note (filing). Total debt outstanding is presented at carrying value, net of unamortized discount and bond issuance costs.
Financial panels should be read across multiple reporting periods rather than a single quarter, and checked against Lam Research’s filings: the fiscal 2026 Form 10-K. Lam Research’s first-quarter fiscal 2027 results were not yet filed when this page was prepared, so the figures here will be superseded.
Lam Research Corporation Company Profile and Business Model
Lam Research says it is a global supplier of innovative wafer-fabrication equipment and services to the semiconductor industry, with core competencies in nanoscale manufacturing enablement, chemistry, plasma and fluidics, and advanced systems engineering. Its products and services are used by leading semiconductor memory, foundry and integrated-device manufacturers to fabricate devices such as non-volatile memory, DRAM and logic devices. The 10-K states that as of August 4, 2026 the company had approximately 23,300 regular full-time employees, of which over 26% were engaged in research and development, with 38% based in the United States, 56% in Asia and 6% in Europe.
The 10-K states that Lam Research operates in one reportable business segment — the manufacturing and servicing of wafer-processing semiconductor manufacturing equipment — because its operating segments qualify for aggregation given similar customer bases and economic characteristics; its chief operating decision maker is the company’s Chief Executive Officer. The filing names Micron Technology, Samsung Electronics, SK hynix and Taiwan Semiconductor Manufacturing Company among its most significant customers during fiscal years 2024 through 2026. Geographically, China, Taiwan and Korea were its three largest revenue regions in fiscal 2026 (tables below).
The fiscal 2026 10-K (filed August 2026) lists Timothy M. Archer as President, Chief Executive Officer and a director since December 2018, and Douglas R. Bettinger as Executive Vice President and Chief Financial Officer. This section profiles the listed company; for how a chipmaking-equipment supplier further up the value chain is profiled, see SaGeminieTech’s ASML company profile.
| Market | FY2026 | FY2025 | FY2024 |
|---|---|---|---|
| Foundry | 54% | 45% | 40% |
| Memory | 39% | 42% | 42% |
| Logic/integrated device manufacturing | 7% | 13% | 18% |
Source: fiscal 2026 10-K, Note 19 (filing). Lam Research says it serves three primary markets: memory, foundry, and logic/integrated device manufacturing; foundry became the largest in fiscal 2026.
| Region | FY2026 | FY2025 | FY2024 | Share of FY2026 (calculated) |
|---|---|---|---|---|
| China | 7,860 | 6,205 | 6,294 | 33.8% |
| Taiwan | 5,223 | 3,445 | 1,672 | 22.5% |
| Korea | 4,505 | 4,128 | 2,874 | 19.4% |
| Japan | 2,171 | 1,881 | 1,460 | 9.3% |
| United States | 1,529 | 1,377 | 1,104 | 6.6% |
| Southeast Asia | 1,246 | 837 | 794 | 5.4% |
| Europe | 699 | 563 | 707 | 3.0% |
| Total revenue | 23,233 | 18,436 | 14,905 | 100.0% |
Source: fiscal 2026 10-K, Note 19 (filing). Revenue is attributed to the geographic location where the customer’s facilities are located, which the company notes may not reflect where devices are ultimately consumed. China was the largest region at 33.8% of fiscal 2026 revenue, with Taiwan and Korea also above 15%.
Lam Research’s revenue has shifted toward foundry customers (54% of fiscal 2026 equipment and upgrade revenue, up from 40% in fiscal 2024) and is concentrated geographically in China, Taiwan and Korea, and in a small number of large customers (four customers were about 55% of fiscal 2026 revenue combined). For the wider industry context see SaGeminieTech’s Semiconductors hub.
Lam Research Corporation Technical Analysis
This widget summarizes technical indicators — moving averages, oscillators and overall signal counts — for LRCX across selected timeframes.
Technical signals change as new data arrives and should not be treated as a recommendation. Consider them together with fundamentals, the cyclicality of semiconductor capital spending that Lam Research’s 10-K describes as a risk, and the timing of quarterly results.
Lam Research Corporation Historical Stock-Price Overview
The overview below covers LRCX price and percentage change across several date ranges, with volume and moving-average context. Lam Research’s reported revenue rose from $14.91 billion in fiscal 2024 to $23.23 billion in fiscal 2026 (table above), while operating margin, calculated from reported figures, moved from 28.6% to 35.3% over the same period. Price history is best interpreted alongside those developments and the cyclical demand pattern the company’s own filings describe, rather than in isolation.
Historical performance does not guarantee future results and reflects a specific past period only.
Lam Research Corporation Shariah Compliance Snapshot
The snapshot below reflects third-party Shariah screening for LRCX based on AAOIFI-derived methodology, as reported by two providers, Zoya and Musaffa. Both public pages were read on 2026-09-22. Screening results change as market capitalization, debt, cash and non-permissible income change — treat this as a starting reference, not a permanent certification. Neither provider’s screen is an AAOIFI certification, and each applies its own thresholds.
Latest Lam Research Corporation News
The feed below may include dynamically updated market stories related to Lam Research.
Distinguish between official Lam Research announcements, SEC filings, earnings releases, analyst commentary and general media coverage. Verify material news through Lam Research’s investor relations page and its SEC filings.
Key Investor Considerations for Lam Research Corporation
Potential Strengths
- Revenue of $23.23 billion in fiscal 2026, up from $18.44 billion in fiscal 2025 and $14.91 billion in fiscal 2024 (company-reported)
- Operating margin of 35.3% and gross margin of 50.5% in fiscal 2026, both improving versus fiscal 2024 (calculated from reported figures)
- Net cash provided by operating activities of $5.86 billion in fiscal 2026, with cash and cash equivalents of $5.58 billion at June 28, 2026
- Growing exposure to foundry customers, 54% of fiscal 2026 equipment and upgrade revenue versus 40% in fiscal 2024
- Ongoing capital return: a $0.26 per share quarterly dividend declared throughout fiscal 2026 and a $10.00 billion share-repurchase authorization from May 2024
Material Risks
- Customer concentration: four customers together accounted for approximately 55% of fiscal 2026 revenue (16%, 15%, 12% and 12% individually)
- Geographic concentration: China, Taiwan and Korea together were approximately 76% of fiscal 2026 revenue (calculated), so demand and export-control policy in these markets can have an outsized effect
- Cyclicality: semiconductor-industry capital spending has historically been cyclical, and the 10-K lists fluctuations in demand for semiconductor manufacturing equipment among its risk factors
- Customer joint ventures, alliances and licensing arrangements, which the 10-K says have the potential to positively or negatively affect Lam Research’s competitive position and market opportunities
- Trade, export-control and geopolitical risk given significant manufacturing and customer operations across Asia, Europe and the United States
- Single reportable segment concentrated in one core business — wafer-fabrication equipment and services — so a downturn in semiconductor-equipment demand affects the whole company
Frequently Asked Questions
What does Lam Research do?
Lam Research designs, manufactures, markets, refurbishes and services wafer-fabrication equipment used in the fabrication of integrated circuits, according to its fiscal 2026 Form 10-K. Its customers include semiconductor memory, foundry and integrated-device manufacturers.
On which exchange is Lam Research listed?
Lam Research’s common stock trades on the Nasdaq Global Select Market under the ticker symbol LRCX, as stated on the cover of its 10-K and shown in the SEC’s ticker and exchange listing.
What is Lam Research’s fiscal year?
Lam Research’s fiscal year is the 52- or 53-week period ending the last Sunday in June. Fiscal 2026 ended June 28, 2026; the company reported revenue of $23,232.69 million and net income of $7,265.40 million for that year under US GAAP.
What markets does Lam Research serve?
Lam Research reports equipment and upgrade revenue across three primary markets: foundry (54% of fiscal 2026 revenue), memory (39%) and logic/integrated device manufacturing (7%), according to the fiscal 2026 10-K.
Does Lam Research pay dividends and buy back shares?
Yes. Lam Research’s quarterly dividend declared was $0.26 per share throughout fiscal 2026, and the company operates under a $10.00 billion share-repurchase authorization approved by its Board in May 2024, including a $200.0 million accelerated share-repurchase agreement settled in June 2026. Confirm current terms on Lam Research’s investor relations page.
Is Lam Research a cyclical company?
Lam Research operates in the semiconductor capital-equipment industry, which its 10-K describes as historically cyclical, tied to customer capital-spending plans and semiconductor demand.
Is Lam Research stock currently Shariah compliant?
Zoya screens LRCX as Shariah-compliant (last updated September 2026) and Musaffa classifies it as HALAL (last updated September 2026), both under AAOIFI-based methodologies. Ratios are not public, so check a current, named screening source before relying on any compliance status.
Conclusion
Lam Research is a large semiconductor wafer-fabrication equipment supplier whose fiscal 2026 revenue of $23.23 billion and operating income of $8.20 billion (company-reported) reflect a shift toward foundry customers and continued demand for advanced manufacturing equipment. That profile is balanced against concentration in a small number of large customers, geographic concentration in China, Taiwan and Korea, the historical cyclicality of semiconductor capital spending, and exposure to export-control and trade policy across the regions where it operates and sells. The tools on this page — charts, financials, technical indicators and news — support ongoing research into Lam Research, but they do not replace a review of its official filings or independent financial, legal, tax or Shariah advice.
This page is informational and is not investment advice, a recommendation to buy, sell or hold any security, or a prediction of future returns. See SaGeminieTech’s Disclaimer.