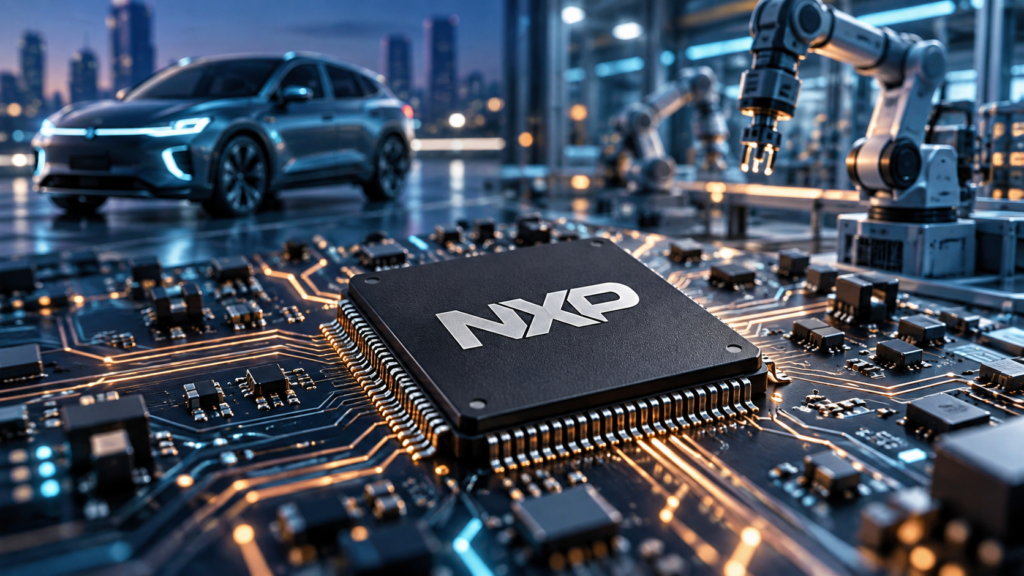
NXP Semiconductors N.V. (NASDAQ: NXPI) is an Eindhoven, Netherlands-headquartered global semiconductor company with over 70 years of operating history, providing microcontrollers, mixed-signal analog, power management, security and RF solutions for automotive, industrial & IoT, mobile and communication-infrastructure applications. This page profiles the listed company and its stock: it brings together TradingView market widgets, financial reference data taken from NXP’s SEC filings, and a dated, clearly labelled third-party Shariah-screening snapshot for research purposes. Widgets update dynamically; the tables and screening notes are static and carry their own reporting periods and dates. For sector context see SaGeminieTech’s Semiconductor hub, the Artificial Intelligence hub and the NASDAQ hub.
NXP Semiconductors N.V. (NXPI) Symbol Information
NXPI trades on the NASDAQ Global Select Market, as stated on the cover of NXP’s annual report, under the ticker symbol NXPI. The panel below summarizes the current symbol — price, exchange and identifying details — as a quick reference before reviewing deeper fundamentals and charts.
Market information shown here may update dynamically throughout the trading session. Verify any material figure through NXP’s official SEC filings; NXP’s own investor-relations website could not be reliably verified as accessible at the time this page was prepared, so this page links to SEC EDGAR directly instead.
NXPI Advanced Stock Chart
The interactive chart below displays NXPI price and volume history across time intervals from intraday to multi-year views. Developments that NXP’s own filings highlight include three fiscal-2025 acquisitions — TTTech Auto ($766 million, safety-critical software-defined-vehicle systems), Aviva Links ($222 million, in-vehicle connectivity) and Kinara ($284 million, edge-AI neural processing units) — and a 2.7% year-over-year revenue decline driven mainly by weakness in the Communication Infrastructure & Other end market. Automotive-semiconductor demand cycles and broader chip-sector sentiment can also influence price. Price history is one input among several and should be read alongside fundamentals.
Chart patterns are not guarantees of future performance. Price movements may reflect quarterly results and guidance, automotive and industrial semiconductor demand trends, or broader sentiment toward chip stocks.
NXP Semiconductors N.V. Financial Statements and Fundamentals
Key figures worth examining for NXP include the revenue mix across its four end markets, the automotive-semiconductor demand cycle, and the gap between operating income and cash returned to shareholders via buybacks and dividends. Revenue was $12,269 million in fiscal 2025, down 2.7% from $12,614 million in fiscal 2024 and $13,276 million in fiscal 2023; operating income was $3,047 million in fiscal 2025, down from $3,417 million in fiscal 2024 (10-K).
Automotive was NXP’s largest end market at $7,116 million (58% of fiscal 2025 revenue), roughly flat year over year, while Communication Infrastructure & Other declined 23.6% to $1,296 million, the main driver of the overall revenue decline.
| Metric | FY2023 (ended December 31, 2023) | FY2024 (ended December 31, 2024) | FY2025 (ended December 31, 2025) |
|---|---|---|---|
| Revenue (reported) | 13,276 | 12,614 | 12,269 |
| Gross profit (reported) | 7,553 | 7,119 | 6,716 |
| Research and development (reported) | 2,418 | 2,347 | 2,360 |
| Operating income (reported) | 3,661 | 3,417 | 3,047 |
| Net income (reported) | 2,822 | 2,542 | 2,068 |
| Net income attributable to stockholders (reported) | 2,797 | 2,510 | 2,021 |
| Diluted net income per share, stockholders (reported) | $10.70 | $9.73 | $7.95 |
| Gross margin (calculated: gross profit ÷ revenue) | 56.9% | 56.4% | 54.7% |
Source: NXP Semiconductors N.V. Annual Report on Form 10-K for the fiscal year ended December 31, 2025 (SEC filing, filed 2026-02-19); fiscal 2024 and 2023 comparatives as presented in that filing. NXP is incorporated in the Netherlands as a public company with limited liability but files a Form 10-K as a U.S. domestic filer; its consolidated financial statements are prepared under U.S. GAAP. Revenue declined modestly in both fiscal 2024 and fiscal 2025, driven mainly by softness in the Communication Infrastructure & Other end market. Rows marked “calculated” are derived by SaGeminieTech from the reported inputs shown.
| Measure | Value (reported) |
|---|---|
| Cash and cash equivalents | 3,267 |
| Total debt (current + noncurrent) | 12,222 |
| Total assets | 26,560 |
| Total stockholders’ equity | 10,056 |
Source: fiscal 2025 10-K consolidated balance sheet and debt notes (filing). NXP’s cash balance includes $361 million held by SSMC, its consolidated joint venture with TSMC, of which 38.8% of any dividend distribution is payable to the joint-venture partner.
Financial panels should be read across multiple reporting periods rather than a single quarter, and checked against NXP’s filings, including the fiscal 2025 Form 10-K.
NXP Semiconductors N.V. Company Profile and Business Model
NXP describes itself as a global semiconductor company with a combined portfolio spanning embedded processing, mixed-signal analog-digital, power management, digital signal processing, cryptography/security, high-speed interface and RF technology. The company reports as a **single reportable segment**, with Chief Executive Officer Rafael Sotomayor serving as chief operating decision maker.
NXP organizes its business around four end markets: Automotive (including core MCUs, in-vehicle networking and infotainment, radar systems and electrification), Industrial & IoT, Mobile (including secure mobile payment and access solutions), and Communication Infrastructure & Other (including 5G radio power and secure edge identification). In fiscal 2025 the company completed three acquisitions — TTTech Auto, Aviva Links and Kinara — extending its automotive software-defined-vehicle, connectivity and edge-AI capabilities. Geographically, APAC excluding China was the largest region at 29% of fiscal 2025 revenue, followed by the Americas (28%), EMEA (27%) and China (17%), with China the only region to grow year over year (table below).
The fiscal 2025 10-K (filed February 19, 2026) lists Rafael Sotomayor as Executive Director, President and Chief Executive Officer, and William J. Betz as Executive Vice President and Chief Financial Officer. This section profiles the listed company; for other semiconductor companies already covered, see SaGeminieTech’s Marvell Technology and Microchip Technology company profiles — NXP’s automotive- and IoT-focused microcontroller and connectivity portfolio is presented here as distinct from Marvell’s data-infrastructure/custom-silicon focus and Microchip’s broader embedded-control product line, not a duplicate of either.
| Category | FY2025 | FY2024 | Share of FY2025 (reported) |
|---|---|---|---|
| Automotive | 7,116 | 7,151 | 58.0% |
| Industrial & IoT | 2,273 | 2,269 | 18.5% |
| Mobile | 1,584 | 1,497 | 12.9% |
| Communication Infrastructure & Other | 1,296 | 1,697 | 10.6% |
| APAC, excluding China | 3,581 | 3,794 | 29.2% |
| Americas | 3,376 | 3,471 | 27.5% |
| EMEA | 3,276 | 3,428 | 26.7% |
| China | 2,036 | 1,921 | 16.6% |
Source: fiscal 2025 10-K, Item 7 MD&A (https://www.sec.gov/Archives/edgar/data/1413447/000141344726000008/nxpi-20251231.htm). NXP operates and reports as a **single reportable segment**; end-market and geographic revenue are disclosed for fiscal 2025 and 2024 only in this MD&A comparison, so fiscal 2023 is not shown here. Geographic attribution is based on the location where the sale originated (a methodology NXP revised and applied retrospectively as of December 31, 2025), which may differ from the customer’s shipped-to location.
NXP’s revenue is concentrated in the Automotive end market (58% of fiscal 2025 revenue) and diversified across four geographic regions. For the wider industry context see SaGeminieTech’s Semiconductor hub.
NXP Semiconductors N.V. Technical Analysis
This widget summarizes technical indicators — moving averages, oscillators and overall signal counts — for NXPI across selected timeframes.
Technical signals change as new data arrives and should not be treated as a recommendation. Consider them together with fundamentals, automotive-semiconductor demand cycles, and NXP’s end-market revenue mix.
NXP Semiconductors N.V. Historical Stock-Price Overview
The overview below covers NXPI price and percentage change across several date ranges, with volume and moving-average context. NXP’s reported revenue declined from $13,276 million in fiscal 2023 to $12,269 million in fiscal 2025 (table above), while operating income declined from $3,661 million to $3,047 million over the same period, reflecting end-market softness, particularly in Communication Infrastructure & Other. Price history is best interpreted alongside those revenue-mix and demand-cycle trends the company’s own filings describe, rather than in isolation.
Historical performance does not guarantee future results and reflects a specific past period only.
NXP Semiconductors N.V. Shariah Compliance Snapshot
The snapshot below reflects third-party Shariah screening for NXPI based on AAOIFI-derived methodology, as reported by two providers, Zoya and Musaffa, plus figures independently calculated by SaGeminieTech from NXP’s SEC filings and a market-capitalization snapshot. Both provider pages were read on 2026-10-01. Screening results change as market capitalization, debt, cash and non-permissible income change — treat this as a starting reference for further verification, not a certification, and not investment or religious guidance.
| Ratio | Numerator | Denominator | Result | Commonly cited threshold |
|---|---|---|---|---|
| Interest-bearing debt ÷ market capitalization | Total debt: $12,222 million, current + noncurrent (10-K, December 31, 2025) | Market capitalization: $59,900 million ([stockanalysis.com](https://stockanalysis.com/stocks/nxpi/), close 2026-09-30) | 20.40% | < 30–33% |
| Cash ÷ market capitalization | Cash and cash equivalents: $3,267 million (10-K, December 31, 2025) | Market capitalization: $59,900 million ([stockanalysis.com](https://stockanalysis.com/stocks/nxpi/), close 2026-09-30) | 5.45% | < 30–33% |
| Non-permissible (interest) income ÷ (revenue + interest income) | Interest income: $145 million (10-K, financial income/expense note, fiscal 2025) | Revenue + interest income: $12,269m + $145m = $12,414m | 1.17% | < 5% |
NXP discloses interest income as its own line within its “Financial income (expense)” note ($145 million for fiscal 2025), separate from interest expense ($466 million) — this figure was independently confirmed against SEC XBRL data and required no correction. The debt ratio of 20.40% is the highest of any company independently calculated on this site to date, exceeding Microchip Technology’s 12.85%, though still well under the commonly cited 30–33% threshold — it reflects NXP’s use of debt financing typical of a large-cap semiconductor company with a substantial buyback and M&A program (including three acquisitions completed in 2025). Market capitalization is a point-in-time figure (2026-09-30 close) applied against fiscal-year-end balance-sheet figures (December 31, 2025); it will move daily and these ratios should be recalculated before relying on them.
Latest NXP Semiconductors N.V. News
The feed below may include dynamically updated market stories related to NXP.
Distinguish between official NXP announcements, SEC filings, earnings releases, analyst commentary and general media coverage. Verify material news through NXP’s official SEC filings.
Key Investor Considerations for NXP Semiconductors N.V.
Potential Strengths
- Automotive end market remains the largest and most resilient revenue source, at $7,116 million (58% of fiscal 2025 revenue), roughly flat year over year despite broader revenue softness
- Three fiscal-2025 acquisitions (TTTech Auto, Aviva Links, Kinara) extend NXP’s software-defined-vehicle, connectivity and edge-AI capabilities
- Non-permissible-income ratio of 1.17% is comfortably under the 5% AAOIFI threshold
- Geographically diversified across four regions, with no single region above roughly 29% of fiscal 2025 revenue
- Single reportable segment with a unified strategy under Chief Executive Officer Rafael Sotomayor as chief operating decision maker
Material Risks
- Total debt of $12,222 million at December 31, 2025 gives NXP the highest debt/market-cap ratio (20.40%) of any company independently calculated on this site to date, though still within the commonly cited threshold
- Revenue declined for two consecutive fiscal years (down 2.7% in fiscal 2025 and 5.0% in fiscal 2024), driven mainly by weakness in the Communication Infrastructure & Other end market
- Operating income fell from $3,661 million in fiscal 2023 to $3,047 million in fiscal 2025 alongside the revenue decline
- Automotive-semiconductor demand is tied to global vehicle production and sales trends, which the 10-K itself notes have stagnated in recent years
- Competitive market: automotive and IoT semiconductors include large, well-resourced competitors
Frequently Asked Questions
What does NXP Semiconductors do?
NXP designs and sells semiconductor products — including microcontrollers, mixed-signal analog, power management, security and RF solutions — for automotive, industrial & IoT, mobile and communication-infrastructure applications, according to its fiscal 2025 Form 10-K.
On which exchange is NXP listed?
NXP’s common stock trades on the NASDAQ Global Select Market under the ticker symbol NXPI, as confirmed against the SEC’s ticker-and-exchange listing.
How many reportable segments does NXP have?
NXP operates and reports as a **single reportable segment**; its Chief Executive Officer serves as chief operating decision maker and uses consolidated results to evaluate the business.
Is NXP profitable?
Yes. NXP reported net income of $2,068 million in fiscal 2025, though this was down from $2,542 million in fiscal 2024 and $2,822 million in fiscal 2023 amid two consecutive years of revenue decline.
Does NXP carry debt?
Yes. NXP has $12,222 million of total debt (current and noncurrent combined) as of December 31, 2025.
How is NXP different from Marvell or Microchip on this site?
All three are semiconductor companies, but this page covers NXP’s automotive- and IoT-focused microcontroller, connectivity and power-management portfolio, distinct from Marvell’s data-infrastructure/custom-silicon focus and Microchip’s broader embedded-control product line.
Is NXP stock currently Shariah compliant?
Zoya screens NXPI as Shariah-compliant and Musaffa classifies it as HALAL, both under AAOIFI-based methodologies (checked 2026-10-01). SaGeminieTech independently calculated all three AAOIFI-style ratios from the 10-K, SEC XBRL data and a same-day market-capitalization snapshot: debt/market cap 20.40%, cash/market cap 5.45%, and non-permissible income 1.17% — all under commonly cited thresholds, with Zoya’s stated interest-income figure confirmed accurate. This is a screening summary, not a compliance certification — check a current, named screening source or a qualified Shariah adviser before relying on any status.
Conclusion
NXP Semiconductors is a global semiconductor company whose fiscal 2025 revenue of $12,269 million (down 2.7% year over year, company-reported) reflects continued strength in its Automotive end market offset by weakness in Communication Infrastructure & Other, alongside three fiscal-2025 acquisitions extending its software-defined-vehicle, connectivity and edge-AI capabilities. The company carries the highest debt-to-market-cap ratio independently calculated on this site to date (20.40%), though still well within commonly cited AAOIFI thresholds. SaGeminieTech independently verified NXP’s Shariah-screening ratios against its own SEC filings, SEC XBRL data and a same-day market-capitalization snapshot, finding all three AAOIFI-style ratios under typical thresholds and confirming Zoya’s stated interest-income figure as accurate. The tools on this page — charts, financials, technical indicators and news — support ongoing research into NXP, but they do not replace a review of its official filings or independent financial, legal, tax or Shariah advice.
This page is informational and is not investment advice, a recommendation to buy, sell or hold any security, or a prediction of future returns. See SaGeminieTech’s Disclaimer.