
SaGeminieTech

Applied Materials, Inc. (AMAT) – Company Overview, Business Model & Stock Analysis

Applied Materials, Inc. (Nasdaq: AMAT) is a Santa Clara, California-based semiconductor company that provides manufacturing equipment, services and software used to fabricate semiconductor chips and, to a smaller extent, displays. This page profiles the listed company and its stock: it brings together TradingView market widgets, financial reference data taken from Applied Materials’ SEC filings, and a dated, clearly labelled third-party Shariah-screening snapshot for research purposes. Applied Materials’ fiscal year is the 52- or 53-week period ending the last Sunday in October, so “fiscal 2025” means the year ended October 26, 2025. Widgets update dynamically; the tables and screening notes are static and carry their own reporting periods and dates. For sector context see SaGeminieTech’s Semiconductors hub, the AI and semiconductor sector analysis and the NASDAQ hub.

Applied Materials, Inc. (AMAT) Symbol Information

AMAT trades on the Nasdaq Global Select Market, as stated on the cover of Applied Materials’ annual report, under the ticker symbol AMAT. The panel below summarizes the current symbol — price, exchange and identifying details — as a quick reference before reviewing deeper fundamentals and charts.


Market information shown here may update dynamically throughout the trading session. Verify any material figure through Applied Materials’ official filings and its investor relations site.

AMAT Advanced Stock Chart

The interactive chart below displays AMAT price and volume history across time intervals from intraday to multi-year views. Developments that Applied Materials’ own filings highlight include a segment-reporting change that folded the former Display segment into Corporate and Other, ongoing U.S. government subpoenas since 2022 relating to China customer shipments and export-controls compliance, and free cash flow of $5.70 billion in fiscal 2025 (calculated). Semiconductor capital-spending cycles, export-control policy toward China, and customer concentration can also influence sentiment, so price history is one input among several and should be read alongside fundamentals. See also SaGeminieTech’s Artificial Intelligence hub.


Chart patterns are not guarantees of future performance. Price movements may reflect quarterly results and guidance, semiconductor capital-spending cycles, export-control and trade policy toward China, or broader sentiment toward semiconductor-equipment stocks.

Applied Materials, Inc. Financial Statements and Fundamentals

Key figures worth examining for Applied Materials include revenue and its mix by segment and geography, gross and operating margin, capital expenditure, cash generation and customer concentration. In fiscal 2025 net revenue was $28.37 billion, up from $27.18 billion in fiscal 2024 and $26.52 billion in fiscal 2023; operating income was $8.29 billion, but net income of $7.00 billion was slightly below fiscal 2024’s $7.18 billion, which the 10-K’s results discussion attributes mainly to non-operating and tax items rather than to weaker operations (10-K). In fiscal 2025, two customers accounted for approximately 19% and 15% of net revenue respectively, and approximately 89% of net revenue came from customers outside the United States.

The most recent quarterly filing covers the quarter ended July 26, 2026 (third quarter of fiscal 2026); Applied Materials reported nine-month fiscal 2026 revenue of $24.04 billion (10-Q). Cash and investments were $12.90 billion (calculated) against interest-bearing debt of $6.56 billion (calculated) at October 26, 2025. During fiscal 2025 the Board declared four quarterly dividends (one at $0.40 per share, three at $0.46 per share) totaling $1.4 billion paid, and approximately $14.0 billion remained available under the share-repurchase authorization at fiscal year-end (10-K).

Applied Materials reported financial figures — US GAAP, $ millions, fiscal years
Metric FY2023 (ended Oct 29, 2023) FY2024 (ended Oct 27, 2024) FY2025 (ended Oct 26, 2025)
Net revenue (reported) 26,517 27,176 28,368
Gross profit (reported) 12,384 12,897 13,808
Research, development and engineering (reported) 3,102 3,233 3,570
Operating income (reported) 7,654 7,867 8,289
Net income (reported) 6,856 7,177 6,998
Diluted earnings per share, $ (reported) 8.11 8.61 8.66
Net cash provided by operating activities (reported) 8,700 8,677 7,958
Capital expenditures (reported) 1,106 1,190 2,260
Gross margin (calculated: gross profit ÷ net revenue) 46.7% 47.5% 48.7%
Operating margin (calculated: operating income ÷ net revenue) 28.9% 28.9% 29.2%
Free cash flow (calculated: operating cash flow − capital expenditures) 7,594 7,487 5,698

Source: Applied Materials Annual Report on Form 10-K for the fiscal year ended October 26, 2025 (SEC filing, filed 2025-12-12); fiscal 2024 and 2023 comparatives as presented in that filing. Applied Materials’ fiscal year is the 52- or 53-week period ending the last Sunday in October; fiscal 2025 and 2024 each contained 52 weeks. Net income declined slightly in fiscal 2025 despite higher revenue and operating income, which the 10-K attributes mainly to tax and other non-operating items rather than to the operating business. Rows marked “calculated” are derived by SaGeminieTech from the reported inputs shown. Figures are in millions of U.S. dollars except per-share amounts.

Applied Materials selected balance-sheet measures — $ millions, as of October 26, 2025
Measure Value (reported)
Cash and cash equivalents 7,241
Short-term investments 1,332
Long-term investments 4,327
Cash and investments, total (calculated: sum of the three lines above) 12,900
Long-term debt (noncurrent) 6,455
Short-term borrowings 100
Interest-bearing debt, total (calculated: sum of the two lines above) 6,555
Total assets 36,299
Total stockholders’ equity 20,415

Source: fiscal 2025 10-K consolidated balance sheet and notes (filing). No current portion of long-term debt was reported at this date.


Financial panels should be read across multiple reporting periods rather than a single quarter, and checked against Applied Materials’ filings: the fiscal 2025 Form 10-K and the third-quarter fiscal 2026 Form 10-Q. Applied Materials’ fourth-quarter fiscal 2026 results and annual report were not yet filed when this page was prepared, so the figures here will be superseded.

Applied Materials, Inc. Company Profile and Business Model

Applied Materials says it provides manufacturing equipment, services and software to the semiconductor, display and related industries. As of October 26, 2025, the company reports operating in **two reportable segments**: Semiconductor Systems, which designs and manufactures equipment for fabricating semiconductor chips (etch, deposition, chemical mechanical planarization, metrology and inspection, wafer packaging and ion implantation, among other steps), and Applied Global Services (AGS), which provides spares, upgrades, services and factory automation software to optimize customer fab performance. The company’s former Display operating segment is now reported within a Corporate and Other category rather than as its own reportable segment, because management no longer considers it significant enough for separate reporting.

Within Semiconductor Systems, foundry, logic and other customers were approximately 67% of fiscal 2025 segment revenue, DRAM 26% and NAND flash 7% (10-K). Geographically, China (30%), Taiwan (24%) and Korea (20%) were the three largest markets by net revenue in fiscal 2025, together with the United States (11%), Japan (8%), Southeast Asia (4%) and Europe (3%) (calculated shares, tables below). The 10-K discloses that Applied Materials has received multiple U.S. government subpoenas since 2022 concerning China customer shipments and export-controls compliance, and states the company is cooperating with these inquiries.

The fiscal 2025 10-K (filed December 2025) lists Gary E. Dickerson as President and Chief Executive Officer, and Brice Hill as Senior Vice President and Chief Financial Officer. This section profiles the listed company; for other semiconductor-equipment and memory suppliers already covered, see SaGeminieTech’s Lam Research, ASML and Micron Technology company profiles.

Applied Materials reportable segments — US GAAP, $ millions, fiscal years
Segment Revenue FY2025 Revenue FY2024 Revenue FY2023 Operating income FY2025 Share of FY2025 revenue (calculated)
Semiconductor Systems 20,798 19,911 19,698 7,379 73.3%
Applied Global Services 6,385 6,225 5,732 1,792 22.5%
Corporate and Other 1,185 1,040 1,087 (882) 4.2%
Total 28,368 27,176 26,517 8,289 100.0%

Source: fiscal 2025 10-K, Note 15 (filing). Applied Materials operates in **two reportable segments** — Semiconductor Systems and Applied Global Services (AGS); the former display operating segment’s results are now included in the Corporate and Other category, as management no longer considers it a significant operating segment for separate reporting.

Applied Materials Semiconductor Systems revenue by end market — share of segment revenue, fiscal years
End market FY2025 FY2024
Foundry, logic and other 67% 68%
DRAM 26% 28%
NAND flash 7% 4%

Source: fiscal 2025 10-K (filing).

Applied Materials net revenue by geographic region — US GAAP, $ millions, fiscal years
Region FY2025 FY2024 FY2023 Share of FY2025 (reported)
China 8,529 10,117 7,247 30.1%
Taiwan 6,857 4,010 5,670 24.2%
Korea 5,608 4,493 4,609 19.8%
United States 3,063 3,818 4,006 10.8%
Japan 2,273 2,154 2,075 8.0%
Europe 962 1,443 2,152 3.4%
Southeast Asia 1,076 1,141 758 3.8%
Total 28,368 27,176 26,517 100.0%

Source: fiscal 2025 10-K, MD&A and Note 15 (filing). Revenue is attributed to the geographic location of the customer’s facility, not necessarily the location of end use. Approximately 89% of fiscal 2025 net revenue was to customers outside the United States.


Applied Materials’ revenue is concentrated in its Semiconductor Systems segment (73% of fiscal 2025 revenue), in foundry and logic customers within that segment (67%), and geographically in China, Taiwan and Korea (74% of fiscal 2025 revenue combined, calculated). For the wider industry context see SaGeminieTech’s Semiconductors hub.

Applied Materials, Inc. Technical Analysis

This widget summarizes technical indicators — moving averages, oscillators and overall signal counts — for AMAT across selected timeframes.


Technical signals change as new data arrives and should not be treated as a recommendation. Consider them together with fundamentals, semiconductor capital-spending cycles, and export-control policy toward China, which Applied Materials’ filings describe as a risk.

Applied Materials, Inc. Historical Stock-Price Overview

The overview below covers AMAT price and percentage change across several date ranges, with volume and moving-average context. Applied Materials’ reported revenue rose from $26.52 billion in fiscal 2023 to $28.37 billion in fiscal 2025 (table above), while operating margin, calculated from reported figures, moved from 28.9% to 29.2% over the same period. Price history is best interpreted alongside those developments and the export-control and customer-concentration factors the company’s own filings describe, rather than in isolation.


Historical performance does not guarantee future results and reflects a specific past period only.

Applied Materials, Inc. Shariah Compliance Snapshot

The snapshot below reflects third-party Shariah screening for AMAT based on AAOIFI-derived methodology, as reported by two providers, Zoya and Musaffa. Both public pages were read on 2026-09-23. Screening results change as market capitalization, debt, cash and non-permissible income change — treat this as a starting reference for further verification, not a certification, and not investment or religious guidance.

Current StatusZoya screens AMAT as Shariah-compliant (AAOIFI standard; last updated September 2026) and Musaffa classifies it as HALAL with an A- rating (AAOIFI-based methodology; last updated September 14, 2026, 2026 Q3 report). The two sources agree as of 2026-09-23 on business activity and overall classification — independent current verification is still required before relying on this
Debt / Market CapRequires verification. Applied Materials’ fiscal 2025 10-K reports interest-bearing debt (long-term debt plus short-term borrowings) of $6,555 million at October 26, 2025 (calculated). This has not been divided by a verified current market capitalization, which is outside this page’s sourcing
Cash + Securities / Market CapRequires verification. Cash, short-term and long-term investments totalled $12,900 million at October 26, 2025 (calculated). Not divided by a verified current market capitalization
Non-Permissible IncomeZoya’s public page states Applied Materials “has not reported any interest income” for fiscal 2025; this does not match the 10-K’s own XBRL data, which tags $406 million of investment/interest income for fiscal 2025 on revenue of $28,368 million. Computed independently from the filing: 406 ÷ (28,368 + 406) = 1.41% of the combined total, below the 5% threshold both providers cite, but flagged here because Zoya’s stated basis for its verdict is inaccurate on this point
Business ActivitySemiconductor and display manufacturing equipment, services and software. No lending, conventional banking, insurance, gambling or alcohol-related activity was found in the 10-K’s description of the business. The company uses interest-rate swaps to hedge its own fixed-rate debt, a treasury-hedging activity rather than a revenue-generating financial-services business
Screening BasisAAOIFI Standard (per Zoya’s and Musaffa’s stated methodologies). The two providers cite different report-basis dates (Zoya: fiscal year ended October 26, 2025; Musaffa: a 2026 third-quarter report), so their agreement is not necessarily on an identical time base
Last ReviewedZoya last updated September 2026; Musaffa last updated September 14, 2026. Both pages were read on 2026-09-23; figures were not independently re-verified beyond the checks stated above
This snapshot is a screening summary for research purposes, not a certification of Shariah compliance and not investment or religious guidance. It reflects two third-party providers whose stated bases differ in date and, on one line, in accuracy; market-capitalization-based ratios are marked “requires verification” above because this page does not have a verified current market-cap source. Confirm the latest status directly with Zoya, with Musaffa, or with a qualified Shariah adviser before relying on any compliance conclusion.

Latest Applied Materials, Inc. News

The feed below may include dynamically updated market stories related to Applied Materials.


Distinguish between official Applied Materials announcements, SEC filings, earnings releases, analyst commentary and general media coverage. Verify material news through Applied Materials’ investor relations page and its SEC filings.

Key Investor Considerations for Applied Materials, Inc.

Potential Strengths

  • Revenue of $28.37 billion in fiscal 2025, up from $27.18 billion in fiscal 2024 and $26.52 billion in fiscal 2023 (company-reported)
  • Operating margin of 29.2% and gross margin of 48.7% in fiscal 2025, both improving versus fiscal 2023 (calculated from reported figures)
  • Net cash provided by operating activities of $7.96 billion in fiscal 2025, with cash and investments of $12.90 billion against interest-bearing debt of $6.56 billion at fiscal year-end (calculated)
  • Two-segment structure (Semiconductor Systems and Applied Global Services) spanning both equipment sales and a recurring services/spares revenue base
  • Ongoing capital return: quarterly dividends totaling $1.4 billion paid in fiscal 2025 and approximately $14.0 billion remaining under the share-repurchase authorization

Material Risks

  • Customer concentration: two customers accounted for approximately 19% and 15% of fiscal 2025 net revenue
  • Geographic and export-control exposure: China, Taiwan and Korea together were about 74% of fiscal 2025 revenue (calculated), and the 10-K discloses multiple U.S. government subpoenas since 2022 concerning China customer shipments and export-controls compliance
  • Cyclicality: semiconductor-equipment demand depends on customers’ capital-spending plans, which the 10-K describes as subject to significant variability
  • Net income declined slightly in fiscal 2025 versus fiscal 2024 despite higher revenue and operating income, reflecting non-operating and tax items
  • Trade policy risk: the 10-K lists changes in and uncertainty around tariffs, export licensing requirements and international trade disputes among its principal risk factors
  • Concentrated segment exposure: with the Display segment folded into Corporate and Other, the great majority of results now depend on the Semiconductor Systems and AGS segments alone

Frequently Asked Questions

What does Applied Materials do?

Applied Materials provides manufacturing equipment, services and software used to fabricate semiconductor chips, and to a smaller extent displays, according to its fiscal 2025 Form 10-K.

On which exchange is Applied Materials listed?

Applied Materials’ common stock trades on the Nasdaq Global Select Market under the ticker symbol AMAT, as stated on the cover of its 10-K and shown in the SEC’s ticker and exchange listing.

What are Applied Materials’ reportable segments?

As of its fiscal 2025 10-K, Applied Materials reports **two** reportable segments: Semiconductor Systems and Applied Global Services (AGS). Its former Display segment is now included within a Corporate and Other category rather than reported separately.

What is Applied Materials’ fiscal year?

Applied Materials’ fiscal year is the 52- or 53-week period ending the last Sunday in October. Fiscal 2025 ended October 26, 2025 and contained 52 weeks; the company reported net revenue of $28,368 million and net income of $6,998 million for that year under US GAAP.

Does Applied Materials pay dividends and buy back shares?

Yes. Applied Materials paid four quarterly cash dividends in fiscal 2025 (one at $0.40 per share, three at $0.46 per share), totaling $1.4 billion, and had approximately $14.0 billion remaining under its share-repurchase authorization at fiscal year-end. Confirm current terms on Applied Materials’ investor relations page.

Is Applied Materials exposed to China export controls?

Yes. The 10-K discloses that the company has received multiple U.S. government subpoenas since 2022 relating to China customer shipments and export-controls compliance, and states it is cooperating with these inquiries. China was approximately 30% of fiscal 2025 net revenue.

Is Applied Materials stock currently Shariah compliant?

Zoya screens AMAT as Shariah-compliant (last updated September 2026) and Musaffa classifies it as HALAL with an A- rating (last updated September 14, 2026), both under AAOIFI-based methodologies. Zoya’s own page states the company has no interest income, which does not match the 10-K’s data; the market-capitalization-based ratios are not independently verified on this page. This is a screening summary, not a compliance certification — check a current, named screening source or a qualified Shariah adviser before relying on any status.

Conclusion

Applied Materials is a large semiconductor-equipment supplier whose fiscal 2025 revenue of $28.37 billion and operating income of $8.29 billion (company-reported) reflect continued demand for advanced manufacturing equipment, following a fiscal 2025 change that folded its former Display segment into a Corporate and Other category alongside its two remaining reportable segments. That profile is balanced against concentration in a small number of large customers, heavy exposure to China, Taiwan and Korea alongside disclosed U.S. government subpoenas concerning China export-controls compliance, the historical cyclicality of semiconductor capital spending, and a slight net-income decline in fiscal 2025 despite higher revenue. The tools on this page — charts, financials, technical indicators and news — support ongoing research into Applied Materials, but they do not replace a review of its official filings or independent financial, legal, tax or Shariah advice.

This page is informational and is not investment advice, a recommendation to buy, sell or hold any security, or a prediction of future returns. See SaGeminieTech’s Disclaimer.
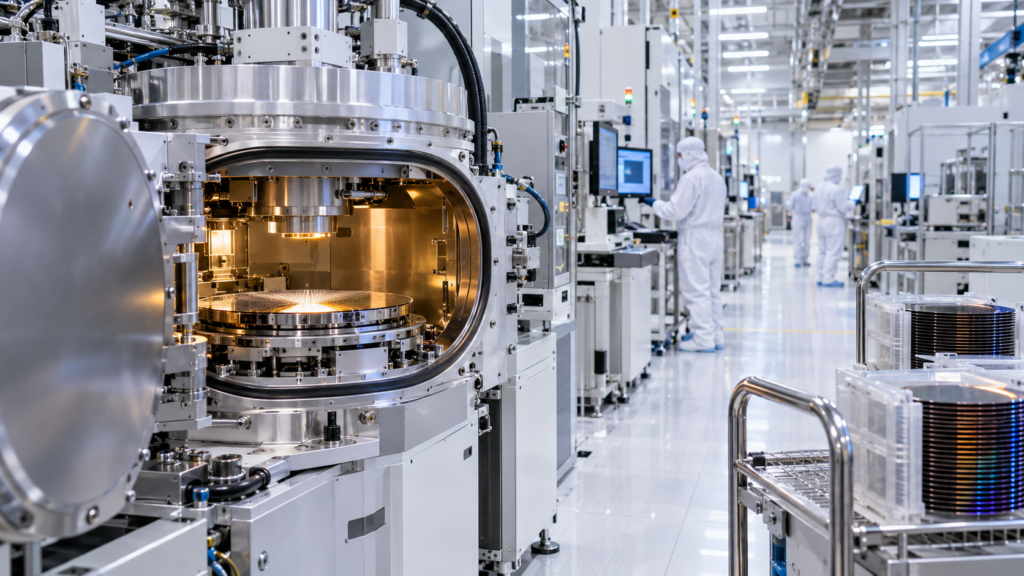
“Semiconductor wafer processing equipment and engineers in a cleanroom, illustrating Applied Materials’ business.”

Scroll to Top