
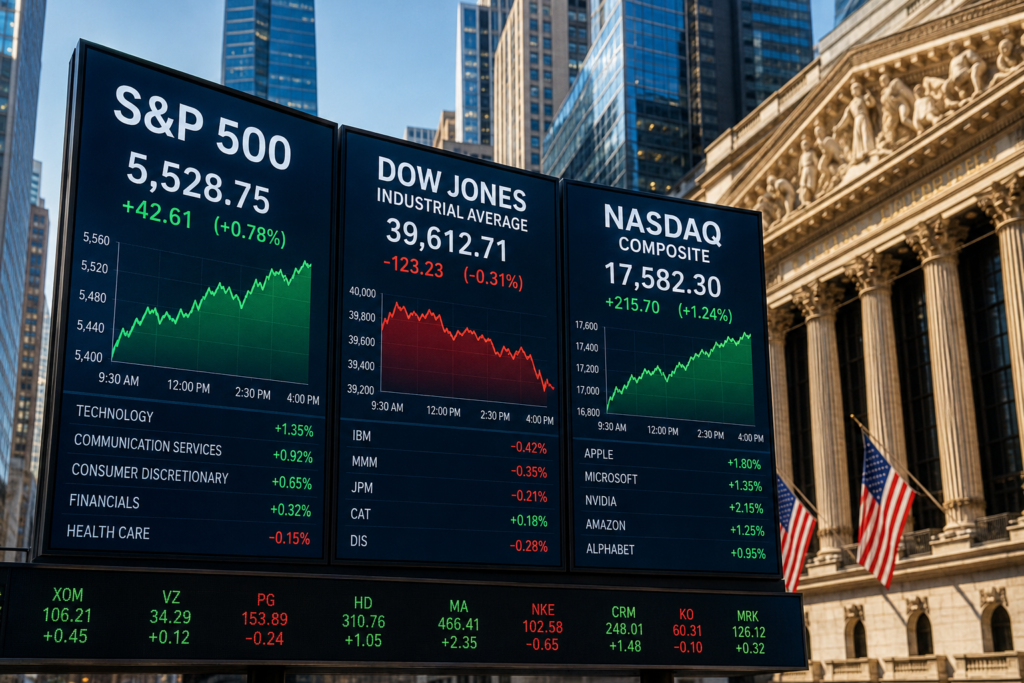
If you’ve ever wondered what people actually mean when they say “the market was up today,” the answer usually comes down to a stock market index. Getting stock market indices explained properly means understanding that an index isn’t a stock you can buy directly — it’s a tool for measuring how a group of stocks is performing together.
The S&P 500, Dow Jones Industrial Average, and Nasdaq Composite are the three most-watched indices in the U.S., each tracking a different slice of the market. This guide breaks down what each one actually measures and why they matter to investors.
What Is a Stock Market Index?
Put simply: an index isn’t a stock, it’s a scorecard — a single number built from a group of stocks so you can tell at a glance whether a market or sector is having a good day or a bad one.
- It’s not a single stock — you can’t buy “the S&P 500” directly the way you buy a share of Apple; indices are tracked through funds (like index funds or ETFs) that mirror their performance.
- It represents a basket of companies — each index selects stocks based on specific criteria, whether that’s company size, exchange listing, or industry sector.
- It moves based on weighted price changes — most major indices are weighted by market capitalization, meaning larger companies have more influence on the index’s overall movement than smaller ones.
- It serves as a benchmark — investors and fund managers use indices to measure whether their own portfolios are outperforming or underperforming “the market.”
- Different indices track different things — which is exactly why the S&P 500, Dow Jones, and Nasdaq Composite don’t always move the same way on a given day.
The S&P 500
Any breakdown of stock market indices explained has to start with the S&P 500 — the benchmark most professional investors watch closest.
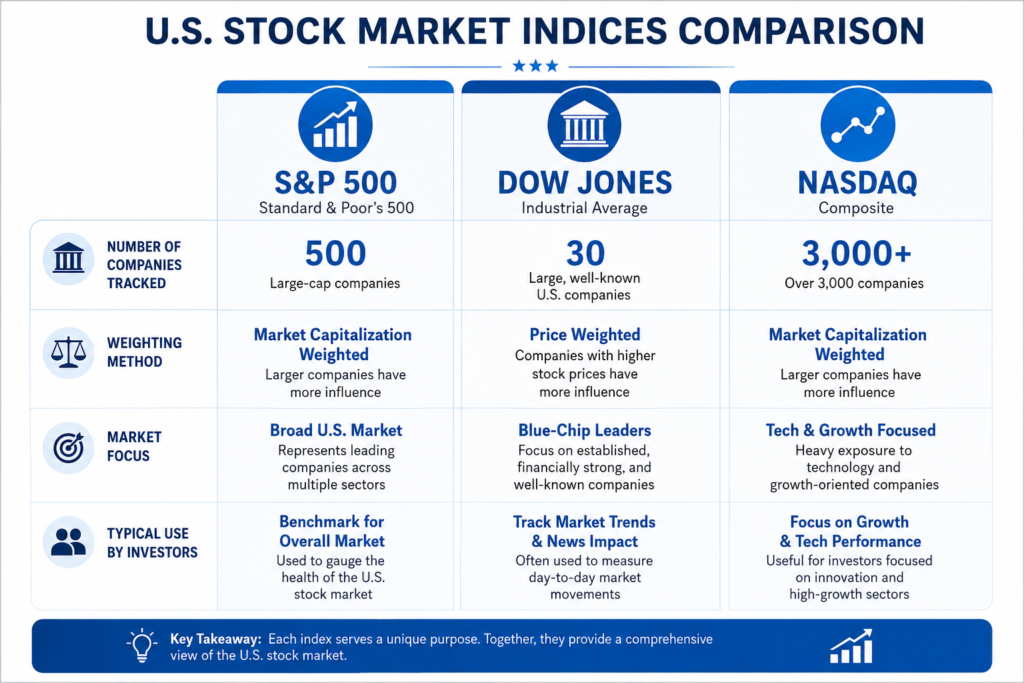
- What it tracks — 500 of the largest publicly traded U.S. companies, spanning nearly every major sector of the economy.
- How companies get selected — a committee selects constituents based on market capitalization, liquidity, and profitability criteria, not just size alone.
- Why it’s considered the best market gauge — its broad sector coverage makes it a more representative snapshot of the overall U.S. economy than narrower indices.
- How it’s weighted — like most major indices, it’s market-cap weighted, meaning giants like Apple or Microsoft move the index more than smaller constituents.
- Why investors track it — it’s the most common benchmark for comparing mutual fund and portfolio performance, and the basis for widely held index funds and ETFs.
For anyone getting stock market indices explained for the first time, the S&P 500 is usually the right starting point.
The Dow Jones Industrial Average
The Dow Jones Industrial Average is the oldest and most recognizable name in any stock market indices explained discussion, even though it works differently than the S&P 500.
- What it tracks — just 30 large, well-established U.S. companies, a far narrower slice of the market than the S&P 500’s 500 constituents.
- How it’s weighted — price-weighted rather than market-cap weighted, meaning a company with a higher stock price moves the index more, regardless of its actual company size.
- Why that matters — this weighting method is considered outdated by many analysts, since a high share price doesn’t necessarily reflect a larger or more influential company.
- Why it’s still watched closely — decades of media coverage and historical significance have made it a household name, even though it’s less representative of the broader economy than newer indices.
It’s a useful reference point, but not the most reliable one on its own.
The Nasdaq Composite
Rounding out any stock market indices explained overview is the Nasdaq Composite, the index most closely tied to technology and growth stocks.
- What it tracks — every company listed on the Nasdaq exchange, over 3,000 stocks, spanning tech, biotech, and other growth-oriented sectors.
- Why it’s tech-heavy — the Nasdaq exchange has historically attracted technology and innovation-focused companies, which is why the index is often used as a proxy for tech sector performance specifically.
- How it’s weighted — market-cap weighted like the S&P 500, meaning giants like Apple, Nvidia, and Microsoft heavily influence its movement.
- Why it can swing harder than other indices — its concentration in growth and tech stocks makes it more volatile than the broader, more diversified S&P 500.
- Why investors watch it — it’s the clearest single gauge of how tech and growth stocks are performing on any given day.

Why Indices Matter for Investors
Getting stock market indices explained isn’t just academic — these numbers directly shape investment decisions every day.
- Benchmarking performance — indices give investors a clear standard to measure whether their own portfolio is actually beating the market or just tracking it.
- Powering index funds and ETFs — many of the most popular low-cost investment vehicles are built to simply mirror an index, making index performance directly relevant to millions of retail investors.
- Signaling broader economic sentiment — sharp index moves often reflect shifting investor confidence about the economy, interest rates, or corporate earnings as a whole.
- Guiding diversification decisions — understanding what each index actually represents helps investors avoid unintentionally overlapping exposure, like holding several tech-heavy funds that all track similar Nasdaq-listed companies.
- Simplifying complex markets — instead of tracking thousands of individual stocks, indices distill market direction into a single, digestible number.
FAQs
What’s the difference between the S&P 500, Dow Jones, and Nasdaq Composite?
They track different groups of companies and use different weighting methods — the S&P 500 covers 500 large companies by market cap, the Dow tracks 30 by share price, and the Nasdaq Composite covers all Nasdaq-listed stocks, skewed toward tech.
Can I invest directly in an index?
Not directly — but index funds and ETFs let you invest in a fund built to mirror an index’s performance.
Closing
Now that stock market indices explained makes a bit more sense, remember that no single index tells the whole story — each measures a different slice of the market. Understanding what you’re actually tracking is the first step to making sense of daily market headlines.
Explore our markets section for more explainers on how the U.S. stock market works.