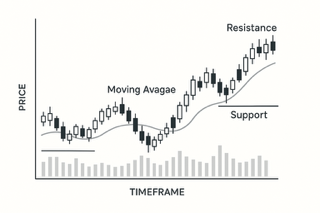
In U.S. equity markets, buying decisions are being made daily under conditions that are neither static nor forgiving. Interest rates remain restrictive by historical standards, earnings visibility varies sharply by sector, and regulatory scrutiny continues to reshape disclosure standards and risk assumptions. In this environment, company stock analysis is no longer an abstract academic exercise; it functions as an operational requirement for investors, founders with concentrated equity exposure, and operators managing corporate treasury risk.
Capital Selectivity and the Cost of Mispricing
What distinguishes the current market is not volatility alone, but decision pressure. Capital has become more selective, valuation dispersion has widened, and the penalty for misjudging downside risk has increased. Two investors evaluating the same ticker may arrive at opposite conclusions based on time horizon, liquidity constraints, and tolerance for drawdowns. As a result, company stock analysis has shifted away from identifying universally “good” stocks toward assessing fit—what works for whom, under which assumptions, and at what cost.
Decision-Support, Not Prediction
This article is written as decision-support journalism. It does not promote strategies or outcomes. Instead, it examines how U.S. investors evaluate financials, valuation, and risk—and why outcomes diverge even when the same data is used. Not all analytical frameworks serve all buyers equally, and misalignment between method and mandate remains a recurring source of loss.
Why Stock Evaluation Standards Have Tightened
Over the past two years, U.S. equity markets have moved away from liquidity-driven pricing toward fundamentals-led scrutiny. Revenue growth without margin durability is discounted more aggressively, and balance sheet leverage—once tolerated—now carries explicit cost.
From Earnings Momentum to Earnings Quality
According to coverage in the Financial Times, investors have increasingly differentiated between accounting earnings and cash earnings. This reflects concern about sustainability rather than momentum. Growth supported by accounting adjustments or working-capital shifts is treated differently than growth supported by durable cash generation.
Upstream Accountability in Valuation
This tightening has structural consequences. Companies with similar headline growth can trade at materially different multiples due to capital structure, customer concentration, or regulatory exposure. The analytical burden has shifted upstream: investors are expected to identify fragility before capital is deployed, not after volatility reveals it.
The Role of Company Stock Analysis in Buyer Risk Management
At its core, company stock analysis acts as a risk-filtering mechanism rather than a return-maximization tool.
Risk Beyond Price Volatility
For institutional allocators, analysis supports mandate compliance. For retail investors, it limits asymmetric downside. For founders and executives, it informs concentration risk tied to personal net worth. Importantly, risk is not limited to price movement. Liquidity constraints, governance quality, reporting transparency, and macro sensitivity all factor into loss severity.
Governance and Disclosure as Loss Amplifiers
Research summarized by the OECD shows that governance and disclosure gaps often amplify losses during downturns—even when operating performance appears stable. Weak oversight, opaque reporting, or concentrated control structures introduce risks that do not always appear in headline financials but surface during stress.
Market Maturity and Information Saturation
U.S. equity markets are among the most information-dense globally. Basic metrics are rapidly priced in, leaving little margin for superficial analysis.
Second-Order Effects Drive Differentiation
Experienced investors increasingly rely on second-order effects: how margins respond to cost inflation, how valuation reacts to interest-rate normalization, or how regulatory shifts alter competitive positioning. As noted in industry briefings from McKinsey, analytical advantage now stems from interpretation rather than access.
Interpretation as a Competitive Edge
In mature markets, insight is not derived from knowing more data, but from understanding how variables interact under different scenarios. This is where company stock analysis becomes less standardized and more judgment-driven.
Reading Financial Statements Beyond Surface Performance
For U.S. investors, financial statements are no longer treated as static scorecards. They are examined as dynamic systems that reveal how a business behaves under stress, allocates capital, and absorbs shocks.
Income Statements and Earnings Quality
Income statements are increasingly analyzed for earnings quality rather than growth alone. Revenue acceleration driven by discounting, short-term contracts, or channel incentives carries different risk implications than growth supported by pricing power or recurring demand. As emphasized by Investopedia, reconciling reported earnings with cash generation is central to distinguishing structural profitability from accounting effects.
Balance Sheets Under Rate Pressure
Balance sheets have taken on renewed importance as financing costs rise. Investors assess not just total debt, but maturity profiles, covenant sensitivity, and exposure to variable-rate obligations. Two companies with similar earnings can exhibit very different risk profiles if one faces near-term refinancing and the other does not.
Cash Flow as a Resilience Signal
Cash flow statements often provide the clearest signal of operational resilience. Sustained negative free cash flow may be acceptable for early-stage growth companies but less defensible for mature firms in competitive markets. Here, company stock analysis becomes contextual: growth-oriented buyers may tolerate burn in exchange for scale, while income-focused investors interpret the same figures as disqualifying.
Segment Economics and Cost Structures
Another layer of analysis involves segment-level disclosure. Aggregate margins can obscure underperforming divisions or overreliance on a narrow profit center. U.S. investors pay close attention to whether high-margin segments are scalable or capped by regulation, competition, or customer concentration. Data compiled by Statista suggests that companies with diversified revenue streams tend to experience less earnings volatility during economic slowdowns, even if their peak growth is lower.
Cost structures are evaluated with similar nuance. Fixed-cost-heavy businesses may deliver operating leverage in expansions but suffer disproportionately during contractions. Variable-cost models offer flexibility but can limit margin expansion. Neither structure is inherently superior; suitability depends on the buyer’s objectives and tolerance for earnings variability.
Why Identical Financials Lead to Different Decisions
It is common for different investors to interpret the same financial data in opposing ways. This divergence reflects mandate differences rather than analytical error. A pension fund prioritizing stability may avoid companies with cyclical cash flows that a hedge fund actively seeks. Founders evaluating their own stock holdings may focus on downside protection, while growth-oriented allocators emphasize optionality.
This is why company stock analysis cannot be reduced to a checklist. Financials inform decisions, but only when interpreted through the lens of use-case, constraints, and time horizon. In the next section, we turn to valuation—how pricing frameworks shape expectations, and where misalignment between price and reality introduces risk.
Integrating Financials, Valuation, and Risk Into a Single Decision
By the time U.S. investors reach a buy—or no-buy—decision, the process has usually moved beyond isolated metrics. Financial performance, valuation discipline, and risk exposure converge into a single question: does this stock align with the buyer’s objectives under realistic conditions? Company stock analysis, at this stage, becomes less about optimization and more about coherence.
The most common failures occur when these elements are assessed in isolation. Strong financials can obscure valuation risk; attractive pricing can mask balance-sheet fragility; low apparent risk can limit upside in ways that conflict with growth-oriented mandates. Investors who experience repeated drawdowns often discover, in hindsight, that the issue was not data quality but analytical misalignment.
This integration process also forces explicit trade-offs. A company with predictable cash flows and conservative accounting may suit income-focused investors but underperform for those seeking capital appreciation. Conversely, businesses reinvesting aggressively at the expense of near-term margins may fit long-horizon strategies while introducing unacceptable volatility for others. Company stock analysis does not resolve these tensions; it clarifies them.
Who This Analytical Approach Serves—and Who It Does Not
The framework described throughout this article is most applicable to buyers making deliberate, capital-at-risk decisions. Long-term investors, founders managing concentrated equity exposure, and operators allocating treasury funds benefit from this layered evaluation. For these groups, understanding downside scenarios is as important as modeling upside potential.
However, this approach may be less suitable for participants whose objectives are purely tactical. Short-term traders operating on momentum or technical signals often prioritize speed over fundamental depth. Applying full-scope company stock analysis in such contexts can slow execution without proportionate benefit. The distinction is not about sophistication, but about use-case alignment.
Similarly, investors unwilling or unable to tolerate interim volatility may find that even well-analyzed positions feel uncomfortable in practice. Analytical clarity does not eliminate emotional or liquidity constraints, and ignoring those realities can undermine otherwise sound decisions.
Long-Term Implications for U.S. Equity Buyers
Looking ahead, the relevance of disciplined company stock analysis is likely to increase rather than diminish. As markets mature and information becomes more uniformly accessible, differentiation shifts toward interpretation, judgment, and risk calibration. Regulatory developments, capital cost dynamics, and evolving business models will continue to reshape what constitutes “fair value.”
For U.S. investors, the enduring advantage lies not in predicting outcomes, but in structuring decisions that remain defensible across scenarios. Company stock analysis, when applied as a decision-support tool rather than a predictive promise, helps investors understand what they are buying, why they are buying it, and under which conditions the decision may need to be revisited.
That clarity does not guarantee success—but it materially reduces the likelihood that outcomes will come as a surprise.