Why U.S. Investors Are Reassessing How They Analyze Stocks
Across U.S. equity markets, investors are actively revisiting how they evaluate public companies—not as a theoretical exercise, but as a practical response to shifting conditions. Persistent interest-rate uncertainty, uneven earnings growth, and heightened regulatory scrutiny have compressed the margin for analytical error. In this environment, company stock analysis has moved from a background competency to a front-line decision tool for portfolio managers, founders allocating treasury capital, and individual investors managing concentrated risk.
What is being decided right now is not whether analysis matters, but which analytical lens fits which decision. Capital is being deployed with clearer awareness that mismatched methods can distort valuation, misread momentum, or misprice risk. The consequences are tangible: overpaying for growth that does not materialize, exiting positions prematurely, or misjudging downside exposure in volatile sectors.
Professional investors are therefore drawing sharper distinctions between fundamental and technical approaches—not as opposing camps, but as tools with different strengths, costs, and failure modes. This article approaches Company Stock Analysis in the U.S.: Fundamental vs Technical Methods Used by Professional Investors as decision-support journalism. The goal is not to advocate a framework, but to clarify where each method performs reliably, where it breaks down, and who should be cautious about relying on it.
Not all approaches suit all buyers. Long-horizon allocators face different constraints than short-term traders. Institutional compliance requirements differ from those of individual investors. Even access to data, software, and research budgets shapes what is realistically usable. Understanding these differences has become essential to avoiding false confidence.
The Market Context Driving Analytical Discipline
U.S. equity markets are mature, information-dense, and highly competitive. Public disclosures are extensive, but interpretation risk remains high. According to analysis frequently cited by McKinsey and the Financial Times, dispersion in stock performance has widened in recent years, increasing the penalty for weak analysis. This has amplified scrutiny around how assumptions are formed and tested.
At the same time, algorithmic trading and passive flows have altered price behavior, complicating signals that once appeared straightforward. Technical indicators can react faster but may overfit noise; fundamentals offer grounding but can lag market repricing. These trade-offs are no longer academic—they shape real capital outcomes.
Framing the Core Analytical Divide
At its core, company stock analysis in the U.S. tends to cluster around two professional disciplines: evaluating what a business is worth versus how the market is behaving. Fundamental analysis interrogates cash flows, balance sheets, competitive position, and governance. Technical analysis studies price action, volume, and pattern behavior to infer supply-demand dynamics.
Neither is universally superior. The analytical risk lies in applying one where the other is required—or assuming either removes uncertainty altogether. The sections that follow unpack how professionals actually use these methods, where costs and constraints emerge, and why outcomes diverge across investor types.
Fundamental Analysis as a Valuation Discipline — Strengths and Limits
Within U.S. markets, fundamental analysis remains the dominant framework for investors whose decisions hinge on long-term value rather than short-term price movement. At its core, this approach asks a restrained but demanding question: What is this company worth based on its economic reality, not its current trading behavior? For pension funds, endowments, corporate treasuries, and many individual investors, this question anchors capital allocation decisions with multi-year consequences.
Professional fundamental analysis typically begins with financial statements, but it does not end there. Revenue quality, margin durability, balance-sheet resilience, and capital allocation discipline matter as much as headline growth. Analysts stress-test assumptions against macro inputs—interest rates, labor costs, and regulatory exposure—before translating projections into valuation ranges. In this context, company stock analysis becomes an exercise in probability-weighted judgment rather than precise forecasting.
This discipline carries advantages that are often understated. Fundamental frameworks force explicit assumptions, making errors diagnosable rather than hidden. They also provide a reference point when markets overshoot—either euphorically or pessimistically. Research frameworks described by institutions such as the OECD highlight that long-term equity returns have historically tracked earnings growth and capital efficiency more closely than short-term price signals, reinforcing why fundamentals remain central for patient capital.
However, the constraints of fundamental analysis are equally material and frequently underestimated.
Time Lag, Interpretation Risk, and Cost Structure
Fundamental data is backward-looking by design. Earnings reports, guidance, and disclosures arrive on fixed schedules, often after markets have repriced expectations. In fast-moving sectors—technology, biotech, or cyclical industries—this lag can expose investors to drawdowns even when the long-term thesis remains intact.
There is also interpretation risk. Two analysts can model the same company and reach meaningfully different conclusions based on growth assumptions, discount rates, or competitive assessments. Unlike technical signals, fundamental outputs are not standardized. This makes replication difficult and introduces analyst dependency—a nontrivial operational risk for buyers without deep experience.
Cost is another factor shaping who benefits. High-quality fundamental analysis requires time, sector expertise, and access to reliable data. Institutional teams absorb this cost as overhead; individual investors often cannot. The result is uneven execution quality, not unequal information access per se.
Who Fundamental Analysis Serves — and Who It Doesn’t
Fundamental analysis is best suited for investors with longer holding periods, tolerance for interim volatility, and governance structures that allow patience. It is less effective for those facing short-term liquidity needs, leveraged positions, or mandates that require frequent mark-to-market decisions.
In U.S. markets, misuse often occurs when fundamentals are applied to timing decisions they were never designed to answer. Valuation can indicate whether to own a stock—but rarely when to enter or exit. That limitation sets the stage for why technical analysis persists alongside it, rather than being replaced.
Technical Analysis as a Market Behavior Tool — Precision and Fragility
If fundamental analysis asks what a company should be worth, technical analysis asks a different, more immediate question: How is the market behaving right now? In U.S. equity markets—where liquidity is deep and information travels quickly—this distinction explains why technical methods remain embedded in professional workflows despite long-standing skepticism from fundamental purists.
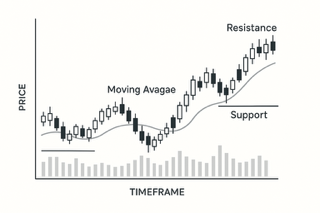
Technical analysis focuses on price, volume, volatility, and trend behavior to infer supply–demand dynamics. Rather than disputing fundamentals, it often brackets them, operating on the assumption that all available information is already reflected in price. For traders, hedge funds, and risk managers, this makes technical tools especially useful when timing matters more than valuation precision.
In practice, technical analysis is less about pattern folklore and more about risk containment. Support and resistance levels, moving averages, and momentum indicators are used to structure entries, exits, and position sizing. As outlined in educational summaries by Investopedia, these tools do not predict outcomes; they help define downside exposure when outcomes are uncertain. That distinction is critical to understanding their professional use.
Speed, Standardization, and Execution Efficiency
One advantage of technical analysis is speed. Signals update in real time, allowing investors to respond quickly to market dislocations, earnings surprises, or macro shocks. This responsiveness is particularly relevant in U.S. markets, where algorithmic trading and passive flows can amplify short-term moves disconnected from fundamentals.
Technical frameworks are also relatively standardized. Indicators mean the same thing across securities, which reduces interpretation variance and allows for systematic execution. This standardization lowers operational cost and enables scalability—an important consideration for funds managing multiple strategies or mandates.
However, efficiency comes with fragility. Technical signals are highly sensitive to regime shifts. A trend-following system that performs well in a stable, liquid environment may fail abruptly during volatility spikes or policy-driven market breaks. Data from market research firms such as Statista shows that short-term volatility in U.S. equities has increased in frequency over the past decade, complicating signal reliability.
Misapplication Risk and Buyer Constraints
Technical analysis is often misapplied by investors who treat signals as forecasts rather than probabilistic guides. Overfitting—designing indicators that work perfectly on historical data but fail in live markets—is a persistent risk. Without disciplined risk controls, technical strategies can accumulate losses quickly.
Buyer suitability therefore matters. Technical analysis tends to benefit investors with clear execution rules, access to real-time data, and the ability to act without delay. It is less suitable for those constrained by infrequent trading windows, higher transaction costs, or emotional decision-making under pressure.
This explains why many professional investors do not choose between fundamental and technical methods, but combine them. The interaction between valuation and market behavior—rather than allegiance to a single framework—often determines whether analysis adds clarity or confusion.
Integrating Methods — Decision Fit, Risk, and Long-Term Implications
For professional investors in the U.S., the debate between fundamentals and technicals has largely moved past ideology. What matters now is decision fit: aligning analytical method with time horizon, risk tolerance, regulatory constraints, and operational reality. Company Stock Analysis in the U.S.: Fundamental vs Technical Methods Used by Professional Investors is less about choosing a side and more about understanding where each method creates clarity—and where it introduces blind spots.
In practice, many institutional workflows separate conviction from execution. Fundamental analysis establishes whether a company merits capital at all, under what assumptions, and with what margin of safety. Technical analysis then informs how exposure is built, adjusted, or reduced in response to market behavior. This division reflects a sober assessment of uncertainty: valuation alone does not prevent drawdowns, and timing alone does not justify ownership.
Trade-Offs That Shape Real-World Outcomes
Each method carries structural trade-offs that buyers must acknowledge. Fundamental analysis demands patience and analytical depth but exposes investors to interim volatility and model risk. Technical analysis offers responsiveness and discipline but can fail abruptly when market regimes shift or liquidity thins.
Cost structures also differ. Fundamental research requires sustained investment in expertise and data interpretation, while technical systems rely more heavily on infrastructure, execution quality, and risk controls. For smaller investors, these costs influence not just returns but feasibility. Misalignment—such as applying short-term signals to long-term capital or vice versa—often explains disappointing outcomes more than market direction itself.
Regulatory and governance considerations further complicate decisions. Institutional investors must justify methodologies to boards, auditors, and regulators. Transparent assumptions and documented processes tend to favor fundamental frameworks, while systematic technical rules can support risk oversight when properly governed. Neither eliminates accountability.
Who Benefits, and Who Should Be Cautious
Long-horizon investors with stable capital, low leverage, and tolerance for volatility tend to benefit most from fundamentally driven decisions augmented by selective technical inputs. Shorter-term participants—traders, tactically managed funds, or investors managing concentrated exposure—often rely more heavily on technical discipline to manage risk, even when fundamentals remain intact.
Those seeking certainty or simplicity should be cautious. No analytical framework removes uncertainty, and overconfidence in either approach can magnify losses. Market maturity in the U.S. means that widely known signals—fundamental or technical—are quickly arbitraged, reducing their standalone edge.
Long-Term Implications for Decision-Makers
As data availability expands and markets evolve, the competitive advantage increasingly lies in how analysis is integrated rather than which method is chosen. The future of company stock analysis in the U.S. points toward hybrid judgment—combining economic reality with market behavior, and accepting that uncertainty is a permanent feature, not a flaw, of equity investing.
For buyers, founders, and operators, the lasting value of analysis is not prediction, but informed restraint: knowing when evidence supports action, when it argues for patience, and when the risks outweigh the narrative.