Why You Should Learn How to Read Stock Charts
Understanding how to read stock charts is a vital skill for any aspiring investor or founder. Whether you’re evaluating a public company’s strength or preparing your own startup for IPO, charts tell a story of performance, volatility, and investor behavior. In this article, you’ll learn the basics of stock chart reading, common indicators, and practical tools to get started.
Want to dive deeper into the startup world? Learn how to scale a business fast.
1. What Is a Stock Chart?
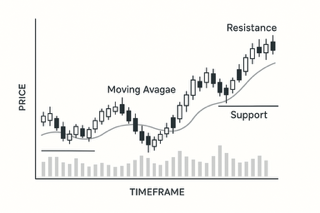
A stock chart is a visual representation of a company’s stock price movement over time. It shows how the stock has performed on a daily, weekly, monthly, or yearly basis. These charts help you analyze market trends, predict price movements, and make informed decisions.
2. The Basics of a Stock Chart
Key components of a stock chart:
- Price Axis (Y-Axis): Shows the stock’s price.
- Time Axis (X-Axis): Shows the timeline (daily, weekly, etc.).
- Volume Bars: Indicate how many shares were traded during a specific time period.
- Candlesticks or Lines: Represent price movement in a given time period.
3. How to Read Candlestick Charts
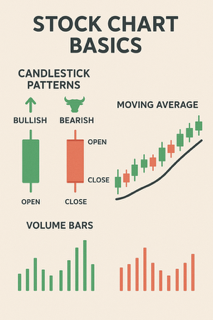
Candlestick charts are the most popular format among traders. Each “candle” represents:
- Open: The price when the session started.
- Close: The price at session end.
- High & Low: The highest and lowest prices within the time period.
Green candles usually mean the price increased, red means it decreased.
Discover how IPOs work and why they matter.
4. Key Indicators to Watch
Here are some indicators that help with chart reading:
- Moving Averages (MA): Shows average stock prices over a time period (e.g., 50-day MA).
- Relative Strength Index (RSI): Measures how overbought or oversold a stock is.
- MACD (Moving Average Convergence Divergence): Shows trend strength and momentum.
5. Spotting Trends and Patterns
Look for these patterns to predict movement:
- Uptrend: Higher highs and higher lows.
- Downtrend: Lower highs and lower lows.
- Sideways: No strong directional movement.
- Support and Resistance: Key levels where price tends to bounce or get rejected.
Understand what makes a startup IPO-worthy.
6. Chart Reading Tools You Can Use
Here are some beginner-friendly (and pro-level) tools to start charting:
- TradingView: Highly visual and customizable.
- Yahoo Finance: Great for historical data.
- MarketWatch: News + chart combo for deeper insights.
- Thinkorswim by TD Ameritrade: Pro-level desktop software for in-depth analysis.
7. Common Mistakes Beginners Make
Avoid these errors when reading stock charts:
- Relying only on one indicator
- Ignoring volume trends
- Not looking at long-term charts
- Getting emotional about short-term drops
Conclusion: Why This Matters Beyond Trading
Learning how to read stock charts isn’t just for traders. As a tech entrepreneur or startup founder, this knowledge helps you:
- Track public companies in your niche
- Strategize your own startup’s path to public listing
- Make smarter investing or business decisions
Explore emerging technologies shaping 2025 startups