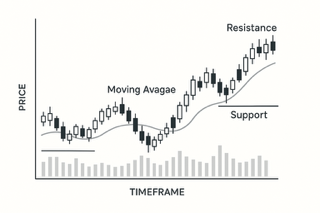
In U.S. equity markets, company stock analysis is no longer an academic routine reserved for long-term portfolio reviews. It has become an active decision point for operators, investors, and allocators responding to uneven valuations across the NASDAQ and NYSE. Capital is moving, but not uniformly. Some sectors are repricing rapidly, while others remain misaligned with their underlying fundamentals. This divergence has pushed many buyers into evaluation mode rather than execution mode.
The pressure comes from uncertainty, not optimism. Interest-rate normalization, persistent inflation sensitivity, and changing earnings expectations have altered how risk is priced. Public commentary from institutions tracked by outlets such as Financial Times and research firms like McKinsey & Company increasingly highlights dispersion rather than broad-market direction. For individual investors and smaller funds, the implication is clear: blanket strategies are no longer reliable, and selection risk has increased.
This environment explains the renewed focus on company stock analysis as a decision-support discipline. Buyers are not simply asking whether a stock is “cheap” or “expensive,” but whether its current pricing reflects realistic operating outcomes under present market constraints. A stock that appears undervalued on historical multiples may still be mispriced if its cost structure, regulatory exposure, or revenue durability has shifted. Conversely, some companies trading below peer averages are doing so for reasons that are temporary rather than structural.
The consequences of misreading this distinction are material. Capital tied up in falsely “undervalued” equities carries opportunity cost, liquidity risk, and reputational risk for professional allocators. At the same time, avoiding all perceived risk can lead to underexposure during periods when selective undervaluation does exist. This tension is why company stock analysis has become a live operational decision rather than a passive research task.
Importantly, not all market participants are solving for the same outcome. Long-horizon investors, short-term traders, corporate insiders, and retirement-focused allocators face different constraints. What constitutes an undervalued stock for one buyer may represent unacceptable volatility or governance risk for another. Any serious Company Stock Analysis Guide: How to Identify Undervalued U.S. Stocks in NASDAQ & NYSE must therefore begin with context: who is deciding, under what constraints, and with what tolerance for downside exposure.
This article approaches company stock analysis from that lens—editorial, comparative, and risk-aware—before examining valuation mechanics, structural signals, and market-specific nuances in the sections ahead.
Valuation Signals That Matter More Than Multiples in U.S. Markets
Traditional valuation metrics still anchor most company stock analysis, but in the current U.S. market structure, raw multiples rarely tell the full story. Price-to-earnings, price-to-sales, and enterprise-value ratios remain reference points, yet their interpretive value depends heavily on capital structure, earnings quality, and forward cost assumptions. This is especially true when comparing companies across NASDAQ’s growth-weighted listings and the more diversified NYSE.
One reason buyers misidentify undervaluation is overreliance on historical averages. A company trading below its five-year median multiple may appear discounted, but that baseline often reflects a different interest-rate regime or margin environment. Research cited by OECD shows that capital costs have structurally reset higher than pre-2020 norms. For leveraged firms, this alone can justify lower valuation bands without implying mispricing.
A more reliable signal in company stock analysis is the relationship between operating leverage and revenue durability. Companies with flexible cost bases and recurring revenue streams tend to absorb macro volatility more efficiently than those dependent on volume growth or discretionary demand. In practice, this means two firms with identical earnings can justify different valuations based on how resilient those earnings are under stress. Market participants increasingly scrutinize margin stability rather than margin size.
Another overlooked factor is internal reinvestment efficiency. Cash flow generation only creates value if it can be redeployed at acceptable returns. Firms that accumulate cash without credible reinvestment paths may trade at discounts that persist. According to analysis referenced by Gartner, capital misallocation has become a primary driver of long-term underperformance, particularly in mature technology segments. In such cases, low multiples reflect strategic uncertainty, not market neglect.
Regulatory exposure also distorts surface-level valuation. Sectors facing evolving compliance costs—financial services, healthcare, and parts of energy—often appear undervalued during transition periods. However, unless regulatory clarity improves, these discounts can represent rational risk pricing. As explained in multiple primers by Investopedia, valuation without regulatory context tends to overstate upside.
Within the Company Stock Analysis Guide: How to Identify Undervalued U.S. Stocks in NASDAQ & NYSE, the key insight is this: undervaluation is rarely a single-metric conclusion. It emerges from how valuation signals interact with durability, capital discipline, and structural risk. Buyers who ignore these interactions may identify “cheap” stocks that remain cheap indefinitely—while those who incorporate them gain a clearer view of where mispricing is temporary rather than permanent.
Structural Market Signals That Separate Temporary Discounts From Structural Risk
Beyond valuation metrics, effective company stock analysis requires attention to market structure—specifically how capital, liquidity, and information flow through U.S. exchanges. The NASDAQ and NYSE operate under the same regulatory umbrella, but they behave differently in practice. These differences influence how and why certain stocks appear undervalued at specific moments.
Liquidity concentration is one such signal. On NASDAQ, capital tends to cluster around a narrow set of high-volume names, particularly in technology and growth-oriented sectors. This leaves smaller or less visible companies vulnerable to sharp repricing when sentiment shifts. Data compiled by Statista consistently shows that a disproportionate share of trading volume is captured by a small percentage of listed firms. For buyers, this creates a paradox: some genuinely undervalued companies remain overlooked simply because they sit outside dominant capital flows, while others trade at discounts because liquidity risk is real and persistent.
In both NASDAQ and NYSE environments, these structural signals reveal why select discounts normalize, whereas others persist as structural pricing features. If exits are driven by mandate constraints or index rebalancing, the resulting price weakness may be temporary. If exits reflect governance concerns, capital discipline issues, or deteriorating disclosures, the discount may be structural. Market filings and ownership disclosures provide signals, but interpretation requires caution. Not all selling pressure implies deteriorating fundamentals.
Information asymmetry also plays a role in mispricing. Companies with complex business models or multi-segment reporting structures often trade at valuation discounts due to analytical friction rather than poor performance. This is particularly common among industrials, logistics firms, and diversified service providers on the NYSE. In these cases, company stock analysis becomes less about forecasting growth and more about understanding whether reported complexity masks stable cash flows or genuine operational risk.
Another factor shaping undervaluation narratives is market maturity. Sectors moving from high-growth to cash-generation phases frequently experience valuation compression. This transition can look like underperformance when measured against historical benchmarks, even if the business has become more predictable. Buyers focused on capital preservation may view this compression as appropriate pricing, while others interpret it as opportunity. The divergence reflects buyer intent, not analytical disagreement.
Within the broader Company Stock Analysis Guide: How to Identify Undervalued U.S. Stocks in NASDAQ & NYSE, these structural signals highlight why some discounts resolve while others persist. Undervaluation is not just a pricing anomaly—it is often the market’s response to liquidity constraints, information gaps, or changing capital preferences. Distinguishing between these forces is essential for buyers seeking clarity rather than confirmation.
Decision Frameworks, Buyer Fit, and Long-Term Implications
By the time buyers reach the end of a Company Stock Analysis Guide: How to Identify Undervalued U.S. Stocks in NASDAQ & NYSE, the central issue is rarely whether undervaluation exists in absolute terms. It is whether a specific stock’s pricing aligns with the buyer’s constraints, time horizon, and risk tolerance. This distinction matters because misalignment, not miscalculation, is the most common source of disappointment in U.S. equity investing.
Company stock analysis becomes most effective when treated as a filtering system rather than a selection shortcut. Buyers who prioritize capital preservation, for example, tend to benefit from undervaluation driven by temporary sentiment shifts or liquidity imbalances, where downside risk is limited by stable cash flows. In contrast, buyers seeking asymmetric upside may accept higher volatility in exchange for exposure to firms undergoing strategic or cyclical inflection points. The same valuation data can support both approaches, but only when interpreted through intent.
Cost structures and balance-sheet resilience play a decisive role in this filtering process. Companies operating with thin margins or high refinancing exposure may appear undervalued relative to peers, yet carry disproportionate downside if macro conditions tighten further. In these cases, discounts reflect embedded risk rather than overlooked value. Conversely, firms with conservative leverage and transparent capital allocation often trade at modest discounts during transitional phases, particularly when growth expectations reset. For long-horizon allocators, these situations can align more closely with risk-adjusted objectives.
Regulatory and governance considerations also shape long-term outcomes. Stocks subject to unresolved compliance frameworks or opaque reporting practices may remain discounted longer than anticipated. While some buyers view this persistence as opportunity cost, others treat it as an implicit signal of uncertainty. Neither interpretation is universally correct. The relevance depends on whether the buyer can tolerate prolonged valuation gaps without liquidity pressure.
Importantly, company stock analysis does not eliminate uncertainty; it reallocates it. The purpose of disciplined analysis is not to predict market behavior with precision, but to understand why outcomes may diverge. Buyers who recognize this tend to frame decisions probabilistically, weighing trade-offs rather than searching for confirmation.
In closing, Company Stock Analysis Guide: How to Identify Undervalued U.S. Stocks in NASDAQ & NYSE underscores that undervaluation is contextual, not absolute. It is appropriate for buyers who value analytical clarity, patience, and structural understanding—and less suitable for those seeking immediacy or uniform outcomes. When applied with that awareness, company stock analysis becomes a tool for informed decision-making rather than expectation-setting, leaving buyers better equipped to navigate both opportunity and risk over the long term.