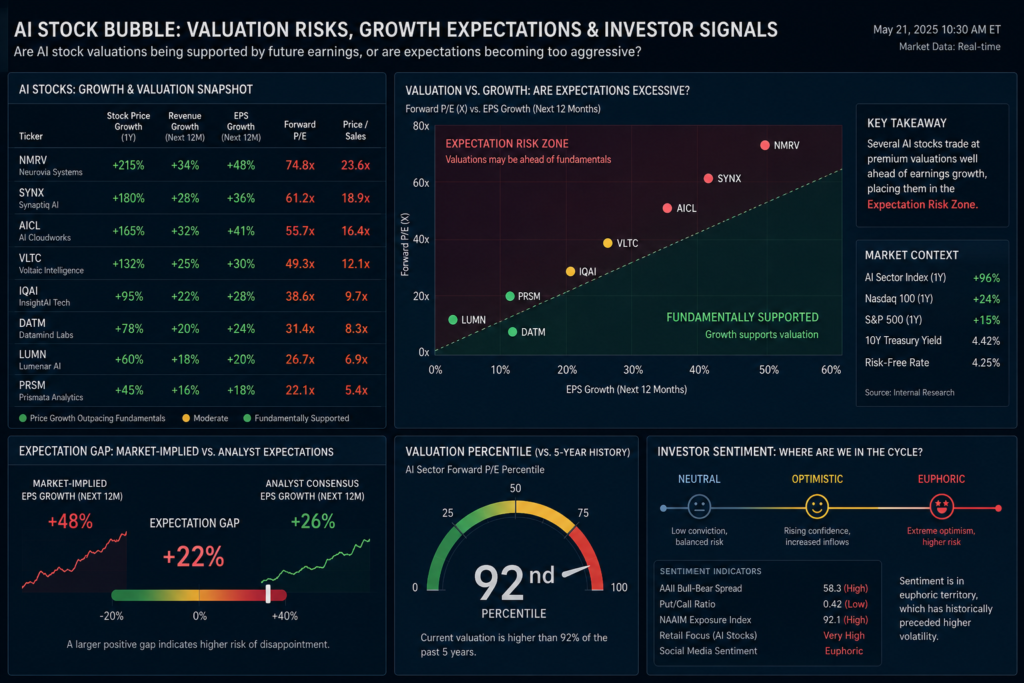
The phrase “AI stock bubble” comes up constantly in 2026 market commentary, and for good reason: a small group of AI-exposed companies now accounts for an outsized share of major U.S. indices, while capital spending on AI infrastructure has climbed into the hundreds of billions of dollars per year. Whether this represents a durable technology buildout or a valuation bubble in the making is genuinely unsettled among analysts, economists and Federal Reserve officials. This article lays out the evidence on both sides — valuations versus history, earnings versus spending, and concentration versus breadth — along with concrete signals investors can track over time.
What Does the “AI Stock Bubble” Debate Actually Mean?
An asset bubble describes a period when prices decouple from what underlying cash flows can reasonably support. The AI stock bubble question asks whether current prices for chipmakers, cloud providers and AI-infrastructure suppliers reflect realistic long-term earnings power, or whether they depend on growth assumptions that may not materialize. For broader context on how this theme fits the rest of the market, see this AI and semiconductor sector analysis. It is not a single yes/no judgment — it involves multiple, partially independent questions: Are valuation multiples stretched relative to history? Is revenue actually following the spending? And is market performance so concentrated in a few names that a disappointment at one company could ripple through diversified portfolios?

Valuations Today vs. Historical Bubbles
Comparisons to the dot-com era are the most common frame for this discussion, and the data cuts both ways. By early 2026, the S&P 500 traded near 23 times forward earnings — the most stretched multiple since the dot-com period — while the Nasdaq-100’s forward price-to-earnings ratio sat around 30, well below the roughly 200x multiple the index reached at its 2000 peak. A key structural difference is profitability: at the dot-com peak, only about 14% of large tech companies were consistently profitable, versus roughly 80% of large tech names being profitable today. Federal Reserve Chair Jerome Powell drew this same distinction at the October 29, 2025 FOMC press conference, noting that today’s highly valued AI-related companies “actually have earnings and stuff like that… they actually have business models and profits,” differentiating the current cycle from 2000. For deeper context on how valuation multiples are calculated, see this guide to P/E, PEG and revenue multiples.
| Metric | Dot-Com Peak (~2000) | AI-Era Market (2026) |
|---|---|---|
| Nasdaq-100 forward P/E | ~200x | ~30x |
| S&P 500 forward P/E | Comparable stretch | ~23x (most stretched since 2000) |
| Large-cap tech companies profitable | ~14% | ~80% |
| Top 10 S&P 500 companies’ earnings share | Below 20% | ~30% |
These figures do not settle the AI stock bubble debate; they show that today’s leading AI companies carry real, growing profits, even as headline valuation multiples sit at their highest levels in a quarter century.
Earnings and Revenue Growth vs. Capital Spending
A central test of the AI stock bubble thesis is whether revenue is catching up to the enormous capital spending. On the spending side, Alphabet, Amazon, Meta and Microsoft guided to a combined roughly $725 billion in 2026 capital expenditures, up sharply from about $410 billion in 2025, according to company guidance compiled by financial media in February 2026. Amazon alone raised its 2026 capex forecast to about $220 billion, citing AI and cloud infrastructure investment, per its official Q2 2026 earnings report.
On the revenue side, cloud growth has accelerated rather than stalled: Google Cloud revenue rose 82% year-over-year to $24.8 billion in a recent quarter, Microsoft Azure grew 43%, and Amazon Web Services grew 37% to $42.2 billion — AWS’s fastest growth in eighteen quarters — with AWS operating margin at 39.4%, per Amazon’s Q2 2026 release. Nvidia, the leading AI-chip supplier, reported Q2 fiscal 2026 revenue of $46.7 billion (up 56% year-over-year), a 72.7% non-GAAP gross margin, and net income of $26.4 billion, per its official quarterly results. Background on Nvidia’s business is available in this Nvidia company overview. These figures support the case that AI spending is generating measurable revenue, even if it has not yet been proven that spending and revenue will stay proportionate as the buildout continues.
A more technical concern feeding skepticism about current AI-related valuations involves depreciation accounting. Several hyperscalers have extended the assumed useful life of servers and GPUs from three-to-four years to five-or-six years, which lowers annual depreciation expense and flatters reported earnings. Critics note that Nvidia’s roughly 18–24 month architecture cycle implies GPUs may lose competitive value faster than these longer schedules assume, meaning reported margins could overstate the durability of current profitability.
Market Concentration: A Handful of Mega-Caps Driving Returns
Beyond valuation and earnings, concentration is a distinct risk factor in the AI stock bubble conversation. According to S&P Dow Jones Indices’ “In the Shadows of Giants” research, the ten largest S&P 500 companies’ combined weight approached roughly 40% of the index in 2025 — a concentration level not seen since the mid-1960s — before easing modestly in 2026. Separately, the “Magnificent Seven” mega-caps represented roughly 33.8% of total S&P 500 market capitalization as of mid-2026. The top 10 companies also trade at a materially higher average P/E (around 31) than the remaining 490-plus S&P 500 constituents (around 21), meaning index-level returns are increasingly a function of a small number of AI-exposed businesses. This does not by itself confirm a bubble, but it does mean a passive S&P 500 investor now has unusually high single-sector, single-theme exposure relative to most of the last sixty years.
Signals Investors Can Monitor
Rather than trying to definitively call an AI stock bubble, many analysts suggest tracking a short list of measurable signals over successive quarters.
Capex-to-Revenue Conversion
Compare each hyperscaler’s capital spending growth to the growth of the cloud or AI revenue it is meant to support. Spending that consistently outpaces revenue growth for multiple quarters is a caution flag; revenue growth that matches or exceeds capex growth, as seen in recent Google Cloud, Azure and AWS results, is a supportive sign.
Margin Trends
Watch operating and gross margins at both chipmakers and cloud providers. Because depreciation assumptions can flatter reported margins, investors may want to look at free cash flow alongside GAAP profitability — notably, Amazon has signaled its free cash flow could turn negative in 2026 as capex ramps, even as reported operating income rises.
Market Breadth
Track how much of index-level return is coming from outside the top 10 holdings. Persistently narrow breadth, where a handful of AI-exposed mega-caps account for most gains, raises the stakes of any single company’s earnings disappointment for diversified index investors. Rising or falling breadth is closely tied to overall market volatility and price fluctuations, particularly around mega-cap earnings dates.
Risks and Limitations
No single metric can resolve the AI stock bubble question in real time. Valuation multiples can stay elevated for years before mean-reverting, or can compress quickly on a growth scare. Reported earnings depend partly on accounting choices, such as depreciation schedules, that can change. Capital-spending plans can be revised up or down within a single earnings cycle, as several companies have already done in 2026. And concentration statistics describe the past, not a guarantee of future index composition. Investors should treat every figure in this article as a snapshot subject to change, not a forecast.
Practical Interpretation for Investors
For U.S. investors, the AI stock bubble debate is less about picking a side and more about position sizing and diversification awareness. Because a passive S&P 500 or Nasdaq-100 allocation already carries concentrated AI exposure through mega-cap weightings, some investors choose to monitor sector and single-stock exposure explicitly rather than assuming an index fund is automatically diversified. Reviewing valuation metrics such as forward P/E and PEG ratios, alongside capex-to-revenue trends and margin data each earnings season, can help investors form their own view rather than relying on a single headline.

Conclusion
The AI stock bubble debate does not have a settled answer, and this article does not attempt to supply one. What the current data shows is a market with historically high valuation multiples but also historically high and growing profitability among the largest AI-exposed companies, paired with capital spending that has outpaced revenue growth in dollar terms even as cloud and chip revenue accelerate. Layered on top is a level of index concentration not seen in roughly sixty years. Investors who track capex-to-revenue conversion, margin quality and market breadth each quarter will be better positioned to judge, on an ongoing basis, whether the evidence is shifting toward a bubble scenario or toward a durable earnings-driven expansion.
This article is for general educational and informational purposes only and does not constitute personalized investment, financial, tax or legal advice. Market data changes frequently; verify current figures before making investment decisions. Investing involves risk, including possible loss of principal, and past performance does not guarantee future results.